Download
1 / 5
50 likes | 55 Views
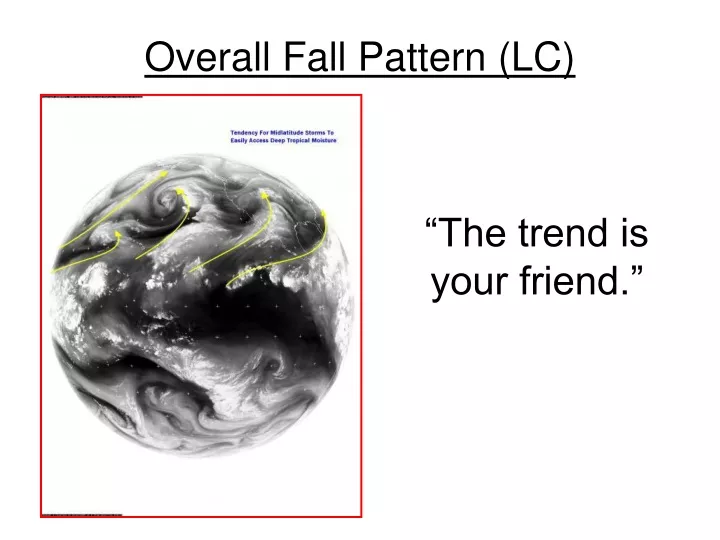
Overall Fall Pattern (LC). “The trend is your friend.”. Significance of October Pattern.

E N D
Overall Fall Pattern (LC) “The trend is your friend.”
Significance of October Pattern • There was a paper published in 2003 in Weather and Forecasting by Chan et. al that discussed the relationship between the 500mb pattern and the relating east coast cold season (November-April) storm frequency. The main finding I took from this paper is that a certain pattern in October more often then not led to an active east coast winter. • This means, that October’s that featured lower than normal 500mb heights near 40N, 130W and relatively higher than normal heights near 25N, 115W could be a signal for an active Winter in the east. • The research showed that in October’s where both these dipoles were present, (8 of the 40 studied), all 8 featured above normal storminess on the east coast. They also showed that Octobers than featured higher than normal zonal winds at 500mb near 30N, 125W, led further confidence to a stormier than normal winter forecast. • However, since most of the month has featured these signals, along with the presence of an El Nino, this piece of evidence could be pointing to a stormier than normal winter across the eastern US if you give credence to this research.
October Temperature and Precipitation • As you can see, if you have a significantly colder than normal October, the odds for a warmer winter diminish. Likewise, the warmer the October, the less likely the odds are for cold. What about snow? Well, if you want snow there's a direct relationship between October temperature and ensuing winter snowfall.Warm Octobers -- 14.9" snowfall average the following winter in four winters"Normal" Octobers -- 22.4" snowfall average in thirteen wintersCold Octobers -- 25.9" snowfall average in twelve wintersOf course, one of the cold Octobers, 1972, ended up being the 'snowless' winter in Philadelphia. So, if we take that out of the equation, the average is 28.3" for 11 winters.
October Temperatures and Precipitation • The NAO state from October to November is important as well for the upcoming winter. Of the 12 winters from 1950 on that have a weak or moderate Nino, 9 have seen a NAO flip from October to November including 4 of the last 5 (2002 being the exception). October's NAO state was negative. If the odds are right, the NAO will flip to positive in November.Of the 9 that see the NAO flip from October to November, only 2 flip back again during the duration of the following winter. That means 7 Nino years of 9 that see an NAO flip in November hold the same NAO state during the upcoming winter. Those seven winters are 1963-64, 1977-78, 1979-80, 1987-88, 1991-92, 1992-93, 1994-95, 2002-03, and 2003-04. That means that if we see the NAO flip in November, there is a 77% chance that the NAO state for the winter as a whole will hold positive. We may see fluctuations where we get colder than normal weather and some significant cool downs but persistent, long-term cold is less likely. Doesn't mean it can't or won't happen, but the odds don't favor it.
October Temperature and Precipitation • Below normal October temperatures correlates to winter being 1 degree below normal on average. • Below normal October temperatures in El Nino winters = 73% of those winters were below normal temperature wise. • Normal October temperatures correlates to winter being 0.5 degrees below normal on average. • Above normal October correlates to winter being 1.5 degrees above normal on average. • Above normal October temperatures, 73% of those winters were above normal. • Above normal October temperatures in El Nino winters = 100% of those winters were above normal temperature wise. • Warmer than normal October = average snowfall of 14. 9 inches • Near normal October = average snowfall of 22.4 inches • Cooler than normal October = average snowfall of 25.9 inches • Note, one cooler October, 1972, was a snow-less winter. Without this the average would be 28.3 inches.