Download
1 / 10
100 likes | 249 Views
SOUTH CENTRAL Region. Regional Composite. REGIONAL DATA REPORT JAN – DEC 2012 vs. 2011. Methodology. Sales and Market Data is obtained using CAST (Category Avocado Sales Trend)

E N D
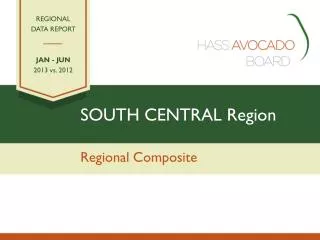
SOUTH CENTRAL Region Regional Composite REGIONAL DATA REPORT JAN – DEC 2012 vs. 2011
Methodology • Sales and Market Data is obtained using CAST (Category Avocado Sales Trend) • Symphony Information Resources Inc. Group (SymphonyIRI Group) gathers chain-wide sales across all RMAs (Retail Market Areas) • Regional figures include data collected from all reporting retailers, as well as imputed data (non-reporting retailers such as club, warehouse and independent stores) for a total of 100% of retail sales for the area • Data is entered into CAST system • Using CAST, data is queried and reported • Average Selling Price (ASP) is not Advertised Retail Price • Average selling price is the average of all prices including coupons, promotional pricing, club/loyalty card deals that are given at the register at the time of purchase • Timeframe: YTD Q4 (January – December) • Retail data provided by SymphonyIRI Group / FreshLook Marketing • Important Note: SymphonyIRI Group / FreshLook Marketing periodically restates retail data, therefore this review cannot be compared or used in conjunction with prior reviews
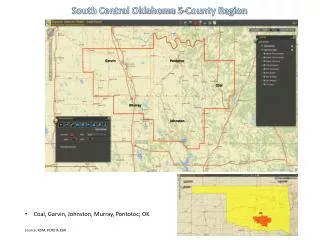
South Central: Region Highlights - YTD Q4 • Overview based on the following markets: • Dallas, TX; Houston, TX; Little Rock, AR • South Central Overview • Avocado retail dollar average trends through Q4 outpaced Fruit and Produce retail dollar trends • Category dollars grew +7% in 2011 and +9% in 2012 for a net growth of +16% over 2010 • Category units declined -22% in 2011, but grew +35% in 2012 for a net growth +5% over 2010 • Category average selling price (ASP) increased +36% in 2011, but declined -20% in 2012 to $0.90/unit • South Central Per Store Averages • 2012 Average dollars of $7,894 per store were +8% higher than 2011 and +16% higher than 2010 • 2012 Average units of 8,751 per store were +42% higher than 2011 and +3% higher than 2010 • South Central versus Total U.S. trends • SC’s category unit growth of +35% was -4 points lower than the national average • SC’s category dollar trend of +9% was -2 points lower than the national average • SC’s 2012 category ASP of $0.90/unit was -2% lower than the national average of $0.92/unit
South Central: YTD Q4 Retail Dollar Trend ComparisonsAvocados vs. Fruit vs. Produce • Avocado retail dollar average trends through Q4 outpaced Fruit and Produce retail dollar trends • 2011 versus 2010, Avocados outpaced Fruit and Produce by +3 points • 2012 versus 2011, Avocados outpaced Fruit by +7 points and Produce by +9 points • 2012 versus 2010, Avocados dollars grew +16% which outpaced Fruit by +10 points and Produce by +12 points
South Central: YTD Q4 Avocado Retail Overview Category dollars grew +7% in 2011 and +9% in 2012 for a net growth of +16% over 2010 Category units declined -22% in 2011, but grew +35% in 2012 for a net growth +5% over 2010 Category average selling price (ASP) increased +36% in 2011, but declined -20% in 2012 to $0.90/unit
South Central vs. Total U.S.YTD Q4 PLU Comparisons • SC’s category unit growth of +35% was -4 points lower than the national average • SC’s lower growth trend was primarily driven by declines by PLUs 4046 and 4770 • SC’s category dollar trend of +9% was -2 points lower than the national average • SC’s lower growth trend was primarily driven by declines by PLUs 4046 and 4770 • SC’s 2012 category ASP of $0.90/unit was -2% lower than the national average of $0.92/unit
South Central: YTD Q4 Category Per Store Averages • In 2012, per store dollar and unit averages exhibited growth over the prior years • 2012 Average dollars of $7,894 per store were +8% higher than 2011 and +16% higher than 2010 • 2012 Average units of 8,751 per store were +42% higher than 2011 and +3% higher than 2010
South Central: 2010 through Q4-2012 Per Store AveragesBy Quarter - Units vs. ASP • Average Retail Units Per Store • The peak quarter was 2012-Q1 at 3,084 units per store when ASP was $0.80/unit • The lowest quarter was 2011-Q3 at 1,905 units per store when ASP was at its highest, $1.30/unit • ASP • Lowest ASP to date occurred during 2010-Q1, $0.76/unit • Highest ASP to date occurred during 2011-Q3, $1.30/unit
South Central: Region Highlights - YTD Q4 • Overview based on the following markets: • Dallas, TX; Houston, TX; Little Rock, AR • South Central Overview • Avocado retail dollar average trends through Q4 outpaced Fruit and Produce retail dollar trends • Category dollars grew +7% in 2011 and +9% in 2012 for a net growth of +16% over 2010 • Category units declined -22% in 2011, but grew +35% in 2012 for a net growth +5% over 2010 • Category average selling price (ASP) increased +36% in 2011, but declined -20% in 2012 to $0.90/unit • South Central Per Store Averages • 2012 Average dollars of $7,894 per store were +8% higher than 2011 and +16% higher than 2010 • 2012 Average units of 8,751 per store were +42% higher than 2011 and +3% higher than 2010 • South Central versus Total U.S. trends • SC’s category unit growth of +35% was -4 points lower than the national average • SC’s category dollar trend of +9% was -2 points lower than the national average • SC’s 2012 category ASP of $0.90/unit was -2% lower than the national average of $0.92/unit
Appendix • Retail scan data is collected and entered into CAST approximately every 4 weeks • Data collection began in 1997 • Data is collected and distributed by Symphony Information Research, Inc. Group (SymphonyIRI Group) / FreshLook Marketing • Data is scrubbed and reviewed for accuracy prior to entry • Total U.S. totals and averages utilized in comparisons includes all regions