Download

1 / 13
130 likes | 264 Views
3-Way Probability & Counting. Group 3 Vanessa Condie Richard Quach Valeria Ramirez January 25, 2011. IE 429 Professor Sima Parisay California State Polytechnic University, Pomona. 3-Way Probability Concept.

E N D
3-Way Probability & Counting Group 3 Vanessa Condie Richard Quach Valeria Ramirez January 25, 2011 IE 429 Professor Sima Parisay California State Polytechnic University, Pomona
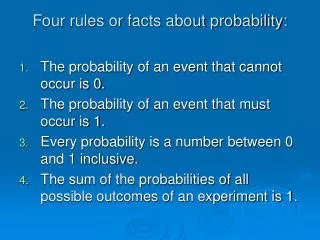
3-Way Probability Concept • This feature is widely used in situations in which we want to know the amount or number of parts, components, units, etc that would be distributed to three different locations. • The importance of the probability lies in the fact that it tells the program what percentage of each item should be allocated to designated location.
Probability, 3-Way Branch and Counting Steps Used to Create a Probability-3 Way in Arena:
Problem Statement * A beverage company produces three different types of beverages: juice, energy drinks, and soda. There are three locations that the beverage company distributes to: grocery stores, restaurants and gas stations. However, the demand at grocery stores is 45% and 30% at gas stations. The beverages arrive to the packing station with an exponential distribution with an average of 5 hrs for the juice, 8 hrs for the energy drinks, and 10 hrs for the sodas. The beverages leave the packing station with a mean of 2 hrs. The beverages then go through inspection and are then distributed to their specific locations. The company would like to know how many of each beverage will be distributed to their respective locations. Run the simulation for 10,000 hours.
Probability, 3-Way Branch and Counting Logical Model: Juice FruitFarm Exp(5 hrs) Grocery Stores 45% PackStation Packing Exp(2 hrs) 30% Gas Stations EnergyDrink ChemicalPlant Exp(8 hrs) 25% Restaurants Soda CaffeineFarm Exp(10 hrs) Simulation length 10,000 hours
Analysis of Output: Probability, 3-Way Branch and Counting
Verification Probability, 3-Way Branch and Counting