Download
1 / 13
140 likes | 312 Views
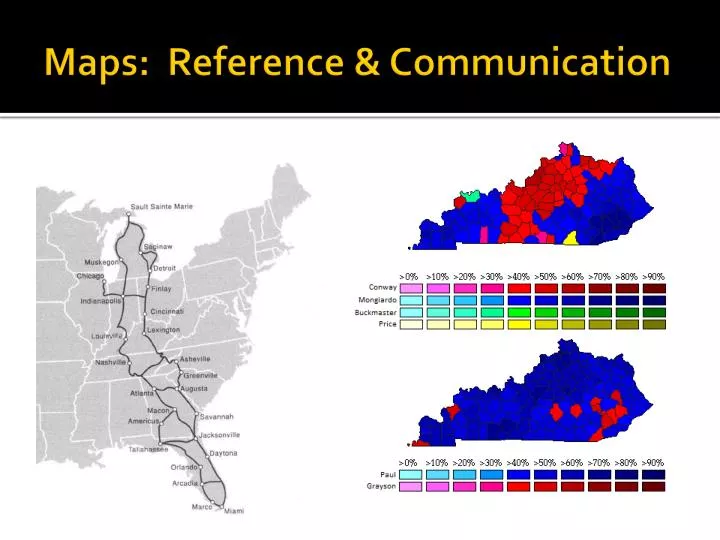
Maps: Reference & Communication. Scale - map. Scale. Maps: Two-dimensional, scaled representations of Earth surface - show spatial data (data with locational component). Cartography (map-making) involves 4 design decisions – based on purpose of map Projection Scale

E N D
Maps: Two-dimensional, scaled representations of Earth surface - show spatial data (data with locational component) Cartography (map-making) involves 4 design decisions – based on purpose of map Projection Scale Aggregation Type of Map (thematic* or reference)
The ratio of map distance to earth distance, measured in the same units Map Scale smaller scale Sample Area CoveredFraction ScaleVerbal Scale World 1:78,000,000 1 in = 1,250 mi No. America 1:36,000,000 1 in = 570 mi Central U.S. 1: 4,000,000 1 in = 64 mi AAA Colo map 1: 1,267,200 1 in = 20 mi larger scale Smaller-scale shows more land area in less detail. Used to show global patterns. Larger-scale shows less land area in more detail. Used on local maps.
Scale Displaying the same geographical features at various scales may also depict misleading results.
Map Aggregation The level of detail for dividing a thematic map into geographic units Ranges from coarse divisions (e.g., by countries) to fine divisions (e.g., by zip codes) Percent of 1990 pop age 25+ with bachelor's degree Data aggregated by State
Percent of pop age 25+ with bachelor's degree (1990) Note what information is lost at higher levels of aggregation Aggregated by State (northeast close-up) Aggregated by County (WV, MA)
THEMATIC MAPS – depict characteristics of places Categorical type - Depict areas that are different in kind - Use several distinct colors to show different categories desert forest tundra Examples: climates, religions Choropleth type - Depict areas that are different in amount - Use shades of similar colors to show different values high value medium low value Examples: population density, literacy rates
Example of “choropleth map” Human Development Index (HDI) Rankings Includes GNI/PPP, Literacy, and Life Expectancy Which regions have high HDI? Which regions have low HDI? Which places are exceptions?
Isoline type(Average Daily Solar Radiation) Lines connect points of equal value Dot Density type(Wisconsin Acreage in Potatoes) Each dot represents a frequency of mapped variable
Proportional Symbol Map (Graduated Circle type) Size of symbol varies in relation to frequency or intensity of the mapped variable Proportional Symbol Map (Flow Vector type)