Download
1 / 34
380 likes | 696 Views
Discovering Pictorial Brand Associations from Large-Scale Online Image Data. Gunhee Kim* Eric P. Xing. School of Computer Science, Carnegie Mellon University *: (now with Disney Research Pittsburgh). December 7, 2013. Outline. Problem Statement Dataset Algorithm

E N D
Discovering Pictorial Brand Associations from Large-Scale Online Image Data Gunhee Kim* Eric P. Xing School of Computer Science, Carnegie Mellon University*: (now with Disney Research Pittsburgh) December 7, 2013
Outline • Problem Statement • Dataset • Algorithm • Visualization – Brand Association Maps • Results • Conclusion
Brand Equity A set of values or assets linked to a brand's name and symbol • Bearing competitive advantage over its competitors • Boosting efficiency and effectiveness of marketing programs • Attaining price premium due to increased customer satisfaction and loyalty Interbrand(2013)
Brand Equity A set of values or assets linked to a brand's name and symbol • Bearing competitive advantage over its competitors • Boosting efficiency and effectiveness of marketing programs • Attaining price premium due to increased customer satisfaction and loyalty Brand Knowledge Brand Awareness Brand Image • [Keller 1993] Brand recall Brand Recognition Types of brand association Favorability of brand association Strength of brand association Uniqueness of brand association Brand Equity • [Aaker 1991] Brand loyalty Name awareness Perceived quality Other properties (ex. trademarks, patens) Brand association
Brand Equity A set of values or assets linked to a brand's name and symbol • Bearing competitive advantage over its competitors • Boosting efficiency and effectiveness of marketing programs • Attaining price premium due to increased customer satisfaction and loyalty Brand Knowledge Brand Awareness Brand Image • [Keller 1993] Brand recall Brand Recognition Types of brand association Favorability of brand association Strength of brand association Uniqueness of brand association Brand Equity • [Aaker 1991] Brand loyalty Name awareness Perceived quality Other properties (ex. trademarks, patens) Brand association
Brand Associations(What Comes to Mind When You Think of …) A set of associations that consumers perceive with the brand • Top-of-mind attitudes or feelings toward the brand basketball, golf, … soccer, national teams, … swimming, diving, beach, …
Brand Associations(What Comes to Mind When You Think of …) A set of associations that consumers perceive with the brand • Top-of-mind attitudes or feelings toward the brand • Consumer-driven brand equity I associate with I need a men’s golf shirts… What would I buy? How can we find out people’s brand associations?
A Traditional Way to Brand Associations Collect direct consumer responses to carefully-designed questionnaires Reese’s [Till et al. 2011] • Expensive and time-consuming • Sampling bias /common methods bias In-N-Out [Dane et al. 2010] Cheap and immediate Candid impression from a large crowd of potential customers Can Web data save us?
‘ ’s Brand Association Map The most important concepts and themes that consumers have • Built from consumer-generated textdata on online social media (eg. Weblogs, Boards, Wiki)
Our Idea: Photo-based Brand Associations Take advantage of large-scale online photocollections • No previous attempts so far to leverage the pictures Our underlying rational • Take a picture and tag as burger+king • Pictorial opinion on burger+king • Crawl millions of online images tagged as burger+king • We can read people’s candid pictorial opinions on burger+king Pictures cannot replace texts. They are complementary. ex) Nike shoes are too expensive. Their design is tacky!
Our Idea: Photo-based Brand Associations Take advantage of large-scale online photocollections • No previous attempts so far to leverage the pictures Why are online images helpful to discover brand associations? 2. Take or bookmark pictures of the products you wish to buy. 1. Brands are recognized by images.
Our Idea: Photo-based Brand Associations Take advantage of large-scale online photocollections • No previous attempts so far to leverage the pictures Why are online images helpful to discover brand associations? 3. Capture interactions between users and products in natural social context
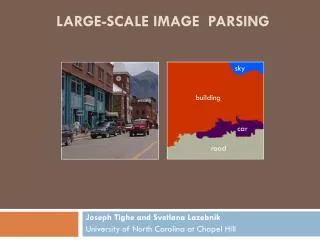
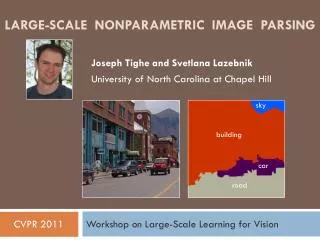
Objective of This Paper Two visualization tasks as a first technical step 1. (Image-level) Detect and visualize key pictorial concepts associated with brands • Identifying a small number of exemplars / image clusters • Project the clusters into a circular layout
Objective of This Paper Two visualization tasks as a first technical step 2. (Subimage-level) Localize the regions of brand in images • A basic function to reveal interactions between users and products • Potential benefits: content-based retrieval and online multimedia ad
Outline • Problem Statement • Dataset • Algorithm • Visualization – Brand Association Maps • Results • Conclusion
Image Dataset from Five Websites Two largest and most popular photo sharing Web communities Various forms of artwork by users Pictures bookmarked by users Photo hosted for twitter 4,720,724 images of 48 brands of four categories Luxury Fastfood Sports Beer
Outline • Problem Statement • Dataset • Algorithm • Visualization – Brand Association Maps • Results • Conclusion
Approach – KNN Graph Generation Input: a set of images of a brand (e.g. louis+vuitton): • Dense feature extraction of Color SIFT and HOG Feature extraction • Histogram intersection for similarity measure KNN Similarity graph • Approximate method (Multiple random divide-and-conquer using meta-data) [Wang et al. 2012] in O(NlogN)
Approach – Exemplar Detection/Clustering Detecting L number of exemplars • A small set of representative images • Diversity ranking algorithm(temperature maximization)[Kim & Xing 2011] • Solving submodular optimization on
Approach – Exemplar Detection/Clustering • Each image Iis associated with its closest exemplar • Random walk model (What exemplar is most likely reachable from each I?) Clustering
Approach – Brand Localization via Cosegmentation Find the regions that are most relevant to the brand • Use MFC algorithm [Kim&Xing. 2012] to each cluster of coherent images • Make parallelization easy and prevent cosegmenting images of no commonality • Optionally, generate bounding boxes
Approach – Closing a Loop Go back to graph generation (Our argument) even imperfect segmentation helps obtain better image similarity measurement. • Not robust against the location and scale change • Image similarity as the mean of best matched segment similarity
Outline • Problem Statement • Dataset • Algorithm • Visualization – Brand Association Maps • Results • Conclusion
Embedding on a Circular Layout Goal: Compute two coordinates of key clusters • Radial distance: a larger cluster closer to the center (Based on Nielson’s BAM) • Angular distance: the smaller, the higher correlation Radial distance • Compute stationary distribution of nodes • Sum of stationary distributions of nodes of each cluster the probability that a random walker stays Angular distance Radial distances
Embedding on a Circular Layout Goal: Compute two coordinates of key clusters • Radial distance: a larger cluster closer to the center (Based on Nielson’s BAM) • Angular distance: the smaller, the higher correlation Angular distance • Pairwise similarity btw clusters S using therandom walk with restart[Sun et al. 2005] • Using spherical Laplacianeigenmap[Carter et al. 2009.] Angular distance Penalty to avoid a trivial solution Similar clusters should havesmaller angle difference Radial distances
Outline • Problem Statement • Dataset • Algorithm • Visualization – Brand Association Maps • Results • Examples of Brand Association Maps • Quantitative results for exemplar detection/clustering • Quantitative results for brand localization • Correlations btw Web image data and actual sales data • Conclusion
Experiments – Brand Association Maps Weddings Events sponsored by brands Brands' characteristic visual themes
Experiments – Exemplar Detection/Clustering Groundtruth for clustering accuracy • Randomly select 100 sets of three (i,j,k) images per class • Accuracy is measured by how many sets are correctly clustered • Manually select which of (j,k) is closer to i: Wilcoxon-Mann-Whitney statistics Similarity btw the clusters of image i and j Sub-M: Multiple runs of our clustering + cosegmentation Sub: Our clustering without cosegmentationKmean/Spect: K-mean clustering / Spectral clustering LP: Label propagation [Raghavan et al. 2007] AP: Affinity propagation [Frey & Dueck 2008] 100
Experiments – Brand Localization Task: Foreground detection • Manually annotate 50 images per class MFC-M: Multiple runs of our clustering + cosegmentation MFC-S: Single run of our clustering + cosegmentationMFC: Random partition + our cosegmentation COS: Submodular optimization [Kim et al. ICCV11] LDA: LDA-based localization [Russell et al. CVPR06] • Accuracy is measured by intersection-over-union
Experiments – Brand Localization Task: Foreground detection • Manually annotate 50 images per class Examples • Accuracy is measured by intersection-over-union
Experiments – Correlation with Sales Data Photo volumes vs. Market share • Nike’s market share is 57.6% in sports brands. How’s about image volumes? • Based on brands’ annual reports Observations • Ranking are roughly similar, but the proportions do not agree. • Guinness : premium beer (more photo data)Taco+bell: cheap fastfood brand (fewer photo data)
Outline • Problem Statement • Dataset • Algorithm • Visualization – Brand Association Maps • Results • Conclusion
Conclusion Study of brand associations from millions of Web images • Complementary views on the brand associations beyond texts • Experiments on 5 Millions images of • 48 brands from five popular websites Jointly achieving two levels of visualization tasks • Visualizing core pictorial concepts associated with brands • Localizing the regions of brand in images Various potential applications • Online multimedia contextual advertisement, competitor mining
Thank You! Extended version will be presented in Press Release http://www.cs.cmu.edu/news/carnegie-mellon-researchers-create-brand-associations-mining-millions-images-social-media-sites