Download
1 / 63
640 likes | 778 Views
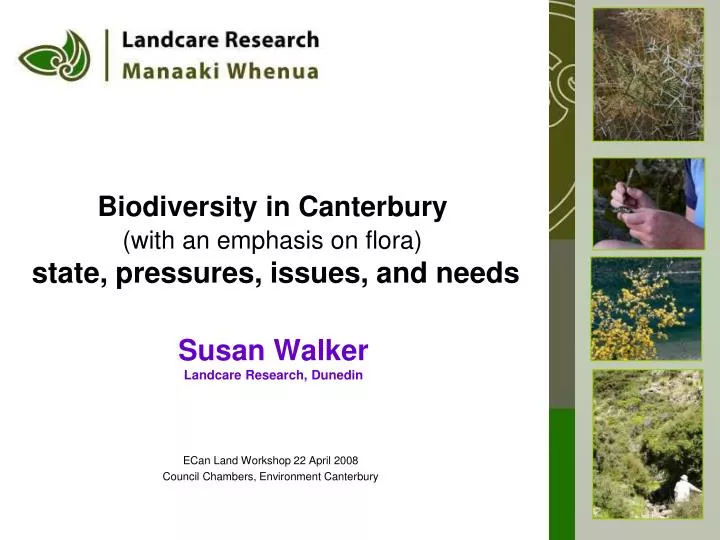
Biodiversity in Canterbury (with an emphasis on flora) state, pressures, issues, and needs . Susan Walker Landcare Research, Dunedin. ECan Land Workshop 22 April 2008 Council Chambers, Environment Canterbury. State.

E N D
Biodiversity in Canterbury(with an emphasis on flora)state, pressures, issues, and needs Susan Walker Landcare Research, Dunedin ECan Land Workshop 22 April 2008 Council Chambers, Environment Canterbury
State • Large variation from upland to lowlandindigenous habitats retained, and protected, are “non representative”
Canterbury habitats - habitat loss to 2001/02 Elevation zones Remaining indigenous cover <400 m 400 – 800 m 800-1200 m 1200-1600 m >1600 m
Protected lands Private covenant or public conservation land Canterbury habitats - protection against loss Elevation zones <400 m 400 – 800 m 800-1200 m 1200-1600 m >1600 m
State • Large variation from upland to lowlandindigenous habitats retained, and protected, are “non representative” • Remaining lowland ecosystems much reduced, highly modified and poorly protected
Habitat loss : some science Area effects 1) The relationship between area and proportion of species remaining is not linear 2) The relationship is a curve Proportion of species remaining 3) As area decreases, at some point the proportion of species decreases rapidly 0 0.2 0.4 0.6 0.8 1.0 Proportion habitat area remaining
An intact environment Proportion of species remaining 0 0.2 0.4 0.6 0.8 1.0 Proportion habitat area remaining
3.9% PREDICTED SPECIES LOSS An intact environment Proportion of species remaining HABITAT LOSS 10% 0 0.2 0.4 0.6 0.8 1.0 Proportion habitat area remaining
Proportion of species remaining A modified environment 0 0.2 0.4 0.6 0.8 1.0 Proportion habitat area remaining
PREDICTED SPECIES LOSS Proportion of species remaining 12% A modified environment HABITAT LOSS 10% 0 0.2 0.4 0.6 0.8 1.0 Proportion habitat area remaining
Canterbury habitats - habitat loss to 2001/02 Elevation zones Remaining indigenous cover <400 m 400 – 800 m 800-1200 m 1200-1600 m >1600 m
Canterbury habitats - habitat loss to 2001/02 >1200 m 800-1200 m 400-800 m (37%) Proportion of species remaining Below400 m(7.5%) 0 0.2 0.4 0.6 0.8 1.0 Proportion habitat area remaining
Protected lands Private covenant or public conservation land Canterbury habitats - protection against loss Elevation zones <400 m 400 – 800 m 800-1200 m 1200-1600 m >1600 m
Canterbury habitats - protection against loss >1600 m 1200-1600 m 800-1200 m Proportion of species remaining 400-800 m(11.5%) Below400 m(1%) 0 20 40 60 80 100 Percent (%) of zone protected (Private Covenants or DOC)
Canterbury habitats - habitat loss to 2001/02 >1200 m 800-1200 m 400-800 m (37%) Proportion of species remaining Below400 m(7.5%) 0 0.2 0.4 0.6 0.8 1.0 Proportion habitat area remaining
Canterbury habitats - protection against loss >1600 m 1200-1600 m 800-1200 m Proportion of species remaining 400-800 m(11.5%) Below400 m(1%) 0 20 40 60 80 100 Percent (%) of zone protected (Private Covenants or DOC)
Habitat loss Habitat remaining Average distance Maximum distance Std dev. No. habitat patches (n) (193) 10 (Andrén 1994) 8 (443) 6 (802) Simulated distance to nearest neighbour 4 (1242) (1297) 2 (1089) (255) (739) (75) (12) (1) (1) 0 0 20 40 60 80 100 Proportion of original habitat in the landscape (%) Fragmentation Isolation effects Below about 30% area remaining, patch isolation increases exponentially(simulation, supported by review of field study results)
Nationally threatened plants in Canterbury Proportion of NZThreatened plants (2005) (Acutely and Chronically Threatened) Proportion of NZ land area Canterbury Canterbury(47%)103 species
60 40 20 0 “Lowland” “Montane” “Subalpine & Alpine” Distribution of threatened plants in Canterbury (2005) By elevation zone No. Acutely and Chronically Threatened plants By ecosystem type No. Acutely and Chronically Threatened plants
Also locally or regionally threatened: ‘common’ palatable or fire sensitive trees and shrubs Hebe cupressoides Tekapo military camp
In other places, more rugged secondary woody species and communities are expanding
State – to sum up • Large variation from upland to lowlandindigenous habitats retained, and protected, are “non representative” • Remaining lowland ecosystems much reduced, highly modified and poorly protected • High numbers of threatened plant species, particularly • in the lowland and montane zones (which are poorly protected) • in highly modified, non-forest ecosystems • Woody vegetation in flux: some winners, some losers
Threatened Environment Classification For each LENZ Level IV environment, the classification shows how much indigenous cover remains & how much is protected
LENZ Canterbury % Indigenouscover left % Protected + Threatened Environment Classification + =
Habitat loss and poor protection: indicators of threatened plant distribution in Canterbury % protected (Private covenants or DOC) Distribution of Canterbury threatened plants (2005) 60 No. Acutely and Chronically Threatened plants 40 20 0 “Lowland” “Montane” “Subalpine & Alpine” % indigenous cover left Percenatge area
Threatened environments: Correlated with threatened plants in covenants Threatened Species in South Island QEII covenants 17 geographically widespread covenants (Nelson, Marlborough, Canterbury, Otago & Southland) 123456 Number of threatened plant species Thanks to Wildlands, esp. Kelvin Lloyd
<10% indigenous cover left (24%) 1.3 million ha (31%) Canterbury’s Threatened Environments 23% New Zealand Canterbury Environment Threat Categories (Proportion Land Area)
Categories 1, 2 & 3 • Environments with much reduced indigenous vegetation • Loss of habitats for native species has been greatest • Communities are often highly modified and depleted • Often provide critical habitat for threatened species • NOTE: Categories 1 & 2 are National Priority 1 in the government’s National priorities for protecting rare & threatened native biodiversity on private land
Birdlings Flat, Canterbury <10% indigenous cover left (Acutely Threatened)
Rakaia Island kanuka forest & <10% indigenous cover left (Acutely Threatened)
River engineering work to protect kanuka forestand dry shrubland at Rakaia Island
Relict kowhai/Plagianthus woodland, South Canterbury<10% indigenous cover left (Acutely Threatened)
Mcleans Island <10% indigenous cover left (Acutely Threatened)
Weka Pass areaNorth Canterbury <10% indigenous cover left (Acutely Threatened)
Limestone ValleySouth Canterbury<10% indigenous cover left (Acutely Threatened) Gentianella calcis subsp. taiko
South Canterbury<10% indigenous cover left (Acutely Threatened) Olearia hectori Aciphylla subflabellata Pseudopanax ferox
Kowhai Bush, Kaikoura 10-20% indigenous cover left (Chronically Threatened)
Banks Peninsula Crater Rim 20-30% indigenous cover left (At Risk)
Ashburton Basin 20-30% indigenous cover left (At Risk)
Categories 4 & 5 • Environments with poorly protected indigenous biodiversity • Loss of habitats for native sp has been less extreme (>30% indigenous cover left), BUT • Poorly protected (<20% of land area) • Often highly modified and depleted • Poorly protected indigenous vegetation may be vulnerable to development, and may receive little conservation management (pest, weed control) • Species are more likely to be in decline or at risk of extinction than in better protected environments
Mackenzie Basin >30% left and <10% protected Critically Underprotected
Mackenzie Basin >30% left and <10% protected Critically Underprotected
Category 6 • Environments with less reduced and better protected indigenous biodiversity • In past these environments have been less suitable for development, therefore more secure to clearance • Particularly important for species that require extensive habitats to survive • Many threatened animals (birds, bats, fish, frogs) now survive only here • BUT Still vulnerable to pest, weeds, other extractive land-use (mining, logging, hydro development)
ShrublandLake Coleridge >30% left and >20% protected (Less Reduced Better Protected)
Forest and scree, Arthurs Pass >30% left and >20% protected (Less Reduced Better Protected)
Pressures on native flora Herbivory
Pressures on native flora Herbivory Weeds