Download
1 / 58
580 likes | 690 Views
Performance 2.0: From Measurement to Management. Jon Desenberg Policy Director The Performance Institute 800 15 th Street NW Third Floor Washington DC 20005 Phone: 202-739-9642 www.performanceweb.org Jon.Desenberg@PerformanceInstitute.org. Why measure?. To Plan? To Comply?

E N D
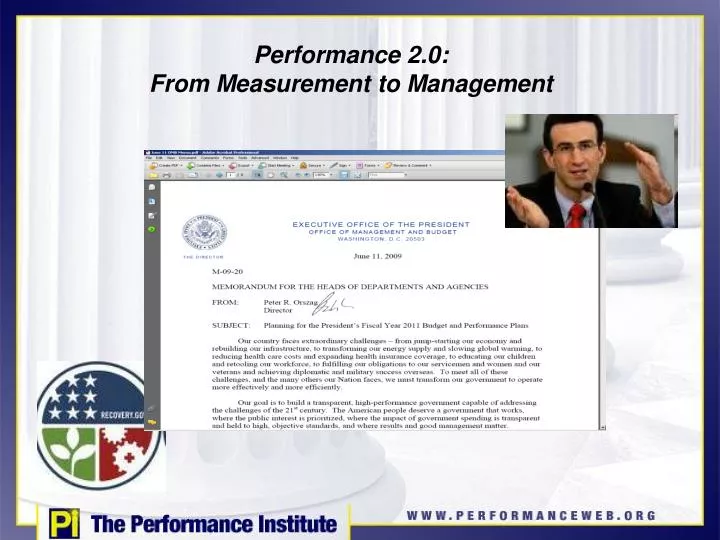
Performance 2.0: From Measurement to Management
Jon Desenberg Policy Director The Performance Institute 800 15th Street NW Third Floor Washington DC 20005 Phone: 202-739-9642 www.performanceweb.org Jon.Desenberg@PerformanceInstitute.org
Why measure? To Plan? To Comply? To Manage? To Optimize? To Innovate? What gets measured gets done. –Peter Drucker
Long-Term Move Towards Performance Performance management is not a new phenomenon—50 years of work in the making to link resources with results • Budget Accounting Procedures Act (BAPA) of 1950 • Planning-Programming-Budgeting System (PPBS), 1965-1971 • Management by Objectives (MBO) 1973-1974 • Zero-Based Budgeting (ZBB), 1977-1981
Finally a Move in the Right Direction • GPRA—(1993) Government Performance Results Act • PMA—(2001) President’s Management Agenda • PART—(2002) Program Assessment Rating Tool • Mandates focusing on performance and accountability—bottom line results
More Timely Reporting for Better Real-Time Decisions OMB has eliminated monthly reporting requirements for the foreseeable future...given the continued demand for timely reporting. The reporting frequency and detail may change slightly over time, reflecting the information needs of the administration and the public, Agencies should begin exploring the accounting and process changes required to update obligations and gross outlays more frequently than a weekly report.
Transparency = Performance Management: • Recovery Act Funds are awarded and distributed in a prompt, fair, and reasonable manner; • The recipients and uses of all funds are transparent to the public, and the public benefits of these funds are reported clearly, accurately, and in a timely manner; • Funds are used for authorized purposes and potential for fraud, waste, error, and abuse are mitigated; • Projects funded under this Act avoid unnecessary delays and cost overruns; and • Program goals are achieved, including specific program outcomes and improved results on broader economic indicators.
Federal Performance : New Developments • A re-focused Process in development • The Federal Chief Performance Officer • Weekly Recovery Act Reporting • Data.gov
Understanding Current Performance Implementation • Four GAO Studies – 1994-2007 • 1994: 19% Outcome Measures • 2007: 50% Outcome Measures • PMA and PART: Checklist or Results? • “Costly and Burdensome”
Performance Management:Have We Forgotten “Why?” • Do the same problems still need our attention? And what are their causes? • Is the strategy effective? • Can it be replicated? • Can we speed adoption? • Can we improve real communication? • To the White House, Congress and (even) appropriators • State, Local, Non-profit and other partners
“We have run out of money, now we must think” – Winston Churchill - 1943
Peak Deficits (% GDP) Predicted Soon Japan UK Russia The Economist June 2009
Performance / Productivity Gains Increasingly Seen as Critical OECD.org –May 2009
What is a logic model? • Logical chain of events providing blueprint for mission achievement • Graphic representation that illustrates the rationale behind a program or organization • Depicts causal relationships between activities, strategies, and end results • Contains goals and performance measures • Integrates various program activities into a cohesive whole • Vehicle for dialogue, planning, program management and evaluation
What does a logic model look like? • Graphic display of boxes and arrows; vertical or horizontal • Relationships, linkages • Any shape • Circular, dynamic • Cultural adaptations, storyboards • Level of detail • Simple • Complex • Multiple models
Logic modeling is based on mapping and defining linkages between what we do and why we do it . Series of If-Then Relationships IF THEN IF THEN IF THEN IF THEN Have Better Image, Feel Better & Live Longer I Work Out for One Hour Each Day I Will Burn More Calories Than I Consume Lose Fat and Build Muscle Improve My Looks and Health INPUTS OUTPUTS OUTCOMES Assumptions: improving looks = better self image Factors: Health History
Clarifying the terms Inputs People and resources required to achieve outcomes Activities/Outputs What the inputs produce End Outcome End goal or ultimate benefit Immediate and Intermediate Outcomes Changes required to achieve end outcome Assumptions: beliefs or evidence that supports your IF-THEN logic Factors: external influences beyond control that effect IF-THEN relationships
Logic Model “V” Top-Line Return Alignment Measurement Linkage Bottom-Line Investment
Value Chain Diagram Distribute program grants “So That” Ultimate Program Intent Child violence and abuse can be prevented and detected Output “So That” Child health and development can be protected and maintained Intermediate Outcome “So That” Children can grow into productive citizens and attain their intended impacts on society Degree of Influence by Department Intermediate Outcome High-Level Outcome
Global Logic Model: Childhood Lead Poisoning Program Early Activities Later Activities Early Outcomes Later Outcomes If we do… Outreach Screening ID of elevated kids Then…. EBLL kids get medical treatment Family performs in-home techniques Lead source identified Environment gets cleaned up Lead source removed And then… EBLL reduced Developmental slide stopped Quality of life improves And we do… Case mgmt of EBLL kids Refer EBLL kids for medical treatment Train family in in-home detection techniques Assess environment of EBLL child Refer environment for clean-up Definition: EBLL – Elevated Blood Lead Levels Module Three: Using Logic Models
Most logic models incorporate the following elements. EFFECT CONTROL Inputs Activities Outputs Intermediate Outcomes Attitudes Behaviors Conditions End Outcomes WHY? HOW
Performance 2.0 Abroad • Desired productivity gains translated into specific input and output targets for every agency Finland • National outcome dashboard for Hospital Waiting Time, Crime, Test Scores, other. New Zealand • Deliberate Move Away from Short Term Output Measures towards fewer, more “nuanced” outcomes U.K.
The British Model • UK Center for the Measurement of Government Activity • Output=Input Formula eliminated in 1993 • Quality adjustment advancements on outputs • Through academic and peer review • Health & Education • Management SWOT Teams • New Calls for True Independent Center
Important Next Steps • Defining “Value” – What Do People really want? • What are the relative preferences for outcomes? • Match with metrics used in regulatory process
Draft Framework: Outcomes for Adult Care Resources and Opportunities Service Offerings Functioning Utility Capability
Connecting Congress with Program Results: • Competition Transparency and Pressure to Perform Cross-Government Results Purchase Agreements for Appropriators • Innovation OMB Examiners: “Beyond Triage Mode” • Dispersion • Enhanced Productivity
The Guidestar Model • Independent Access to Metrics and Budget Information • GAO / CBO both reluctant to play this role • OMB not deemed objective • Meet Growing Demand
Taking Performance to the Next Level • Incremental Improvements: No Longer Acceptable? • Senate Bill 3521 – Is the One Year Budget Cycle Preventing Performance? • Should Front Line Managers keep their Savings?
Discussion & Diagnostics • Breaking Out of the “Performance Office” to: • Understand the issue’s “drivers” • Discover why performance levels vary • Find different interventions for different circumstances • Enhance Knowledge Sharing across programs
Connecting Both Ends of Pennsylvania Avenue • To Monitor and Control the White House? • Ensuring Each District’s Interests are Secured? • To Regularly Evaluate & Re-authorize? • To Sunset Programs? • Naming and Shaming? • To Begin Using More Data?
Key Members of Congress Senator Claire McCaskill Former State Auditor New Subcommittee Chair Senator Tom Coburn “Waste of the Day” “Dr. No” / USA Spending.gov Cong. Dennis Moore Blue Dog Policy Chair PAYGO Emphasis Budget Committee Senator John Cornyn Transparency and Oversight emphasis
Why is Congress Unhappy with Current Reporting? “This site is not providing data that the public can understand”
H.R.2142 - Government Efficiency, Effectiveness, and Performance Improvement Act • Each agency head should consult with the congressional committees with jurisdiction over the agency each fiscal year regarding the agency performance plan. • Each agency head, in collaboration with OMB, to conduct an assessment of each agency program at least once every five fiscal years: • assessing the program’s purpose, • strategic plan and objectives, • organizational design, • management, • efficiency, and • effectiveness in achieving its performance objectives and identifying strengths and weaknesses and factors affecting program success.
HR 2412 Would Require OMB To: (1) make available, by May 1 of each year, a list of programs to be assessed and the criteria and methodology that will be used; (2) submit in a report to Congress, at the same time the President submits the annual federal budget, assessment results, including an identification of program best practices for allocating resources and recommendations for modifications focusing on opportunities for consolidation and integration of programs and authorities; and (3) develop an improvement plan, which the agency head shall implement, that responds to the assessment report and identifies follow-up actions to improve program performance. Rep. Henry Cuellar
Views from The Hill • “The Information is buried in thousands of p ages that we end up throwing out.” • “I pick up the phone and call GAO, PART is political.” • “They act as if we appropriate by goals. We want information by program area.” • The Bush Administration redesigned the budget process so that we couldn’t find core information.”
How Do We Evaluate Performance Management? • Past decisions are viewed as rational if the outcome was good. • If performance management is always ex post and subjective, honest evaluation of intelligence becomes difficult.
The Knowledge – Data Gap • Lessons are learned inadequately, • Memories are recalled incompletely, • The futures is predicted inaccurately, • Data rarely overcomes preconceived notions.
When The Data isn’t enough Possible Solutions: • Rich histories • Multiple observers and multiple interpretations • Hypothetical histories
A Data Driven Culture Embraces Experimentation Think of: • Trial programs, pilot studies, and small experiments, and about the inferences that can be drawn from them. • Does the Government embrace experimentation?
How to Get Fired at Harrah’s “Institute a program without first running a data driven experiment.”- Gary Loveman
A Learning Organization • An average of 300 data “experiments” per day • Increased Retention by 87% • Lowered the cost of a new account by 83% • Stock price outpaced S & P by a factor of ten Learning Testing Acting
Analytical Expertise:How do we get there? 371 Large and Medium Sized Companies Jeanne G. Harris Institute