Download
1 / 19
210 likes | 372 Views
A Land Cover Map of Eurasia’s Boreal Ecosystems S. BARTALEV, A. S. BELWARD Institute for Environment and Sustainability, EC Joint Research Centre, Italy D. ERCHOV Center of Forest Ecology and Productivity, Russia. Global Land Cover 2000. SPOT 4 - VEGETATION Data. Type of data product

E N D
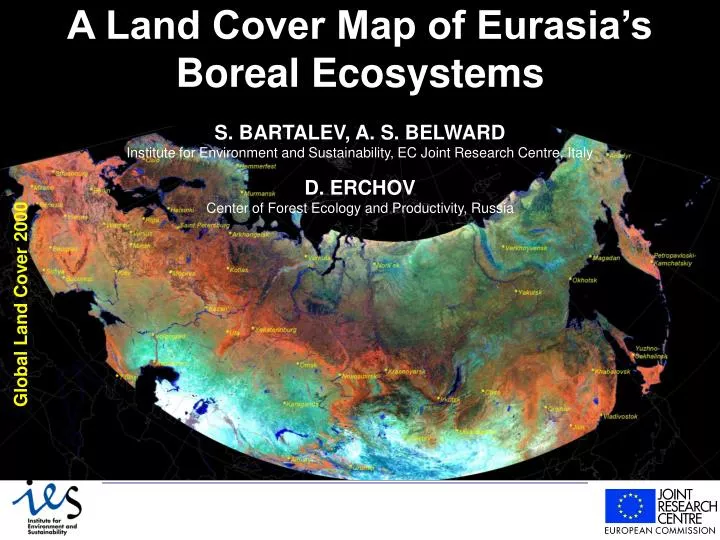
A Land Cover Map of Eurasia’s Boreal EcosystemsS. BARTALEV, A. S. BELWARDInstitute for Environment and Sustainability, EC Joint Research Centre, Italy D. ERCHOVCenter of Forest Ecology and Productivity, Russia Global Land Cover 2000
SPOT 4 - VEGETATION Data Type of data product Standard S10 products including: • Spectral channels • NDVI • Angular information • Status map Geographic window :420N - 750N and 50E -1800E Time window :3d decade of March 1999 – 1st decade of November 1999 (23 of S10 products)
Initial labelling of clusters Merging of semantic clusters into thematic classes Decomposing of ambiguous semantic clusters Derived Auxiliary Products SPOT4-VGT S10 data Generated masks Land Cover Mapping Method STEP 1: Image pre-processing and generation of advanced data products STEP2: Image classification Seasonal mosaics Spectral-temporal clusters map ISODATA clustering of seasonal mosaics Wave-Likeness Index Semantic clusters map Contaminated pixels and snow cover detection Generation of the advanced data products Anisotropy Index Wetness Index Mono-semantic clusters map Snow Cover GIS Database (topographic and thematic maps, DEM, forest inventory statistics and etc) Land Cover Map
Normalised Difference Snow Index From Hall et al., 1998: "Algorithm Theoretical Basis Document (ATBD) for the MODIS Snow-, Lake Ice- and Sea Ice-Mapping Algorithms. Version 4.0"
Detection of the contaminated pixels Step 1: Detection of the pixels utterly contaminated by snow and clouds with pre-specified thresholds pixel with co-ordinates at fixed decade of observation t* set of pixels with presence of snow or/and ice set of pixels with presence of clouds set of pixels without presence of snow/ice or clouds
Detection of the contaminated pixels Steps 2J: Detection of the defective detectors and “slightly” contaminated by snow/clouds pixels with adaptive thresholds derived from time series of data
spring summer autumn Seasonal Mosaics
(NDVI max, t max) (NDVI e, t e) a 0.8 0.7 b -1 0.6 a 0.5 NDVI 0.4 b -1 d 0.3 d 0.2 (NDVI b, t b) 0.1 0 t1 t2 t3 t4 t5 t6 t7 t8 t9 … … … … … tn-1 tn time of observation Wave-Likeness Index (WLI) Cropland where
Bi-spectral Gradient Wetness Index (BGWI) Analysing pixel SWIR BGWI NIR Pure Water Summer Mosaic NIR-MIR-RED BGWI-NDVI- BGWI Wetland
Surface Anisotropy Relative Linear Indexes (SARLI) RED-NIR: Slope - Slope - Interception NIR-MIR: Slope - Slope - Interception SARLI is derived based on the linearised RPV Bi-directional Reflectance Distribution Function model to characterise a surface anisotropy properties
Floristic differences Removed for GLC 2000 Global legend. New class = Evergreen needle leaf The SibTREES Land Cover Classes
Available Country-wide Forest Inventory Data to compare with GLC2000 Map Forest inventory database contains for each forest management unit the data on forest area, tree species composition, volume, area of non-forested land categories and some other information
Forest Management Units selected for comparison with GLC 2000 map 679 forest management units
GLC 2000 Map in comparison to SPOT-HRV image SPOT-VGT Image SPOT-HRV Image Simplified Forest Map Simplified GLC 2000 Map
Ongoing development to improve the Northern Eurasia’s GLC2000 Product • splitting some of the forest classes according to trees cover density • reducing of ambiguity between “cropland” and “grassland” classes • introducing to the map legend the mosaic classes such as “cropland/natural vegetation” and “forest/other vegetation” • comparison (pre-validation checking) with available forest inventory and other available land cover data to expose main divergences