Download
1 / 33
330 likes | 489 Views
Near Real-time Evapotranspiration Estimation Using Remote Sensing Data. by Qiuhong Tang 24 Oct 2007 Land surface hydrology group of UW. Outline. ❶. ➢. Introduction. ET estimation algorithm. ❷. MODIS data and near real-time operational system. ❸. Retrospective ET estimation. ❹.

E N D
Near Real-time Evapotranspiration Estimation Using Remote Sensing Data by Qiuhong Tang 24 Oct 2007 Land surface hydrology group of UW
Outline ❶ ➢ Introduction ET estimation algorithm ❷ MODIS data and near real-time operational system ❸ Retrospective ET estimation ❹ Conclusions and Future Plan ❺
Introduction • Many water resources and agricultural management applications require the knowledge of surface evapotranspiration (ET) over a range of spatial and temporal scales. • However, it is impractical to obtain ET using ground-based observations over large area. • Satellite remote sensing is a promising tool to estimate the spatial distribution of ET with minimal use of in situ observational data. • The objective of this study is to map near real-timeET spatial distribution over large areas using primarily remote sensing data. ❶ Introduction Tang, Qiuhong 24 Oct 2007 Slide 3
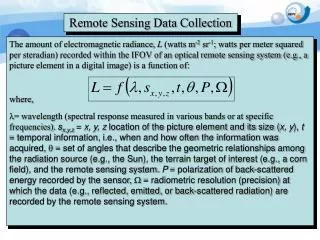
Introduction Remote sensing cannot readily provide atmospheric variables like wind speed, air temperature, and vapor pressure that are needed to estimate evaporation over large heterogeneous areas. Figure from NASA. http://asd-www.larc.nasa.gov/erbe/ An operational ET estimation algorithm is adopted in this study. • Critical model input and parameters are routinely available at daily time. • The algorithm is robust. ET estimations are constrained by energy and mass conservation and have relatively lower sensitivity to input data. • The algorithm is insensitive to constraints imposed by the daily overpass of the satellite and cloud screening. ❶ Introduction Tang, Qiuhong 24 Oct 2007 Slide 4
Outline ❶ Introduction ➢ ET estimation algorithm ❷ MODIS data and near real-time operational system ❸ Retrospective ET estimation ❹ Conclusions and Future Plan ❺
GCIP SRB (Surface Radiation Budget) ET
1-fveg fveg Evaporation Fraction (EF) Q: available energy which an be transferred directly into atmosphere as either sensible heat flux (H) or latent flux. Q = H + ET = Rn – G; EF is a linear parameter for ET; EF is a suitable index for surface moisture condition; EF is nearly constant during most daytime in many cases and is useful for temporal scaling; Linear two-source model ❷ ET estimation algorithm Tang, Qiuhong 24 Oct 2007 Slide 7
EF of soil (EFsoil) EF of soil is related to temperatures and available energy of soil. [Nishda et al, 2003] Qsoil0 is the available energy when Tsoil is equal to Ta. EF of vegetation (EFveg) Assuming the complementary relationship and the advection aridity: ET + PET = 2 ET0 i.e. ET + PETPM = 2 ETPT EFveg is [Nishda et al, 2003]: (It is a controversial equation.) = 1.26 is Priestley-Taylor's parameter. is derivative of the saturated vapor pressure in term of temperature. is psychrometric constrant ❷ ET estimation algorithm Tang, Qiuhong 24 Oct 2007 Slide 8
ra (aerodynamic resistance) U : wind speed. Wind speed is estimated from 1/rsoil = 0.0015 U1m. rc (surface resistance of the vegetation canopy) f(Ta): temperature factor f(PAR): photosynthetic active radiation factor f(VPD): VPD = e* -e = saturated vapor pressure – vapor pressure f(u): leaf-water potential factor f(CO2): CO2 concentration control stomatal conductance ❷ ET estimation algorithm Tang, Qiuhong 24 Oct 2007 Slide 9
Outline ❶ Introduction ET estimation algorithm ❷ ➢ MODIS data and near real-time operational system ❸ Retrospective ET estimation ❹ Conclusions and Future Plan ❺
Data processing flowchart GCIP SRB *The resolutions of remote sensing data vary from 250m to 500m. The data are reprojected to 0.0025 degree resolution. **When the temperature data becomes available, the ET is estimated. ***Composite technique is used for time insensitive data. The most recent available data are used when the data are not available because of cloud. ❸ MODIS data and operational system Tang, Qiuhong 24 Oct 2007 Slide 11
Remote sensing data- MOD11A1 (Land Surface Temperature/Emissivity Daily L3 Global 1km) LST at Day Time LST at Night Time Day view time Night view time Sample data: Aug 01 2007 ❸ MODIS data and operational system Tang, Qiuhong 24 Oct 2007 Slide 12
Remote sensing data- MOD09GQ (Surface Reflectance Daily L2G Global 250m) GCIP SRB Surface Reflectance (620-670 nm) Surface Reflectance (841-876 nm) Cloud state Albedo ❸ MODIS data and operational system Tang, Qiuhong 24 Oct 2007 Slide 13
Data processing – NDVI and Temperatures RS imagery Window Image resolution = 0.0025 degree Window size = 0.125 degree 8 days composite ❸ MODIS data and operational system Tang, Qiuhong 24 Oct 2007 Slide 14
Data processing – Temperatures (Tsoilmax, Tsoil, Tsoilmin) NDVI / LST Window T (LST) Tsoilmax Tsoil Tsoilmin VI (NDVI) Tsoilmax Tsoil Tsoilmin (Ta, Tveg) ❸ MODIS data and operational system Tang, Qiuhong 24 Oct 2007 Slide 15
Land surface energy partition Rd Ru Ld Lu (incoming short-wave radiation) (reflected short-wave radiation) (incoming long-wave radiation) (outgoing long-wave radiation) GCIP SRB (GCIP SRB) (albedo) (temperature, emissivity) (temp, emissivity, albedo) ❸ MODIS data and operational system Tang, Qiuhong 24 Oct 2007 Slide 16
Land surface energy partition Qsoil Qveg Qall PAR GCIP SRB Available energy: Q = Rn – G = (1-Cg) Rn ❸ MODIS data and operational system Tang, Qiuhong 24 Oct 2007 Slide 17
Results – EF, instantaneous ET EF ET_ins (W s-2) ET_ins (mm/day) ❸ MODIS data and operational system Tang, Qiuhong 24 Oct 2007 Slide 18
Results – daily ET Assume: 1) EF does not change within one day, which is truth in many cases in daytime. 2) Temperatures for longwave radiation estimation: ETallday = Qallday * EF ETallday (W s-2) ETallday (mm/day) Temperature Tday Tnight 6:00 14:00 24:00 6:00 Local Time ❸ MODIS data and operational system Tang, Qiuhong 24 Oct 2007 Slide 19
Outline ❶ Introduction ET estimation algorithm ❷ MODIS data and near real-time operational system ❸ ➢ Retrospective ET estimation ❹ Conclusions and Future Plan ❺
The Remote Sensing evapotranspiration estimation approach was performed at the domain of (124.5W,119.5W,37.5N,44N) in 2004. The Remote Sensing estimated evapotranspiration was compared with the evaporation estimated by 1/16 degree VIC model. RS ET LAND COVER ❹ Retrospective ET estimation Tang, Qiuhong 24 Oct 2007 Slide 21
ETallday: 1.45 mm/ day ET_VIC: 1.27 mm/ day Klamath River Basin Daily Monthly ❹ Retrospective ET estimation Tang, Qiuhong 24 Oct 2007 Slide 22
Klamath River Basin VIC ET RS ET DIFF (VIC - RS) 1.27 mm/ day 1.45 mm/ day ❹ Retrospective ET estimation Tang, Qiuhong 24 Oct 2007 Slide 23
ETallday: 1.36 mm/ day ET_VIC: 0.80 mm/ day Klamath River Basin – Irrigation Area Daily Monthly ❹ Retrospective ET estimation Tang, Qiuhong 24 Oct 2007 Slide 24
Klamath River Basin – Irrigation Area VIC ET RS ET DIFF (VIC - RS) 0.80 mm/ day 1.36 mm/ day ❹ Retrospective ET estimation Tang, Qiuhong 24 Oct 2007 Slide 25
Outline ❶ Introduction ET estimation algorithm ❷ MODIS data and near real-time operational system ❸ Retrospective ET estimation ❹ ➢ Conclusions and Future Plan ❺
Conclusion and Future Plan 1) An operational ET estimation system using remote sensing data is developed. 2) The system is daily updating. The algorithm is robust and flexible. 3) The result will be calibrated and validated with ground observations. 4) High resolution remote sensing data such as ASTER, TM data may be used in the future. 5) Estimated ET in irrigation area may be used for agriculture management. ❺ Conclusions and Future Plan Tang, Qiuhong 24 Oct 2007 Slide 27
❺ Conclusions and Future Plan Tang, Qiuhong 24 Oct 2007 Slide 28
Land surface hydrology group of UW http://www.hydro.washington.edu/forecast/rset_ca/
References Nishida, K., R. R. Nemani, S. W. Running, and J. M. Glassy (2003), An operational remote sensing algorithm of land surface evaporation, J. Geophys. Res., 108(D9), 4270, doi:10.1029/2002JD002062. Cleugh, Helen A., Leuning, R., Mu, Q., Running, S.W. (2007). Regional evaporation estimates from flux tower and MODIS satellite data. Remote Sensing of the Environment, 106(3), 285-304. Jiang, L., and S. Islam (2001), Estimation of surface evaporation map over southern Great Plains using remote sensing data, Water Resour. Res., 37(2), 329-340.