Download
1 / 29
290 likes | 377 Views
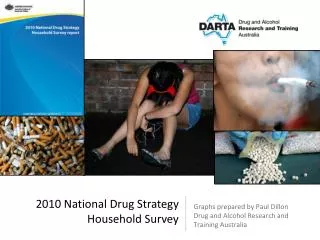
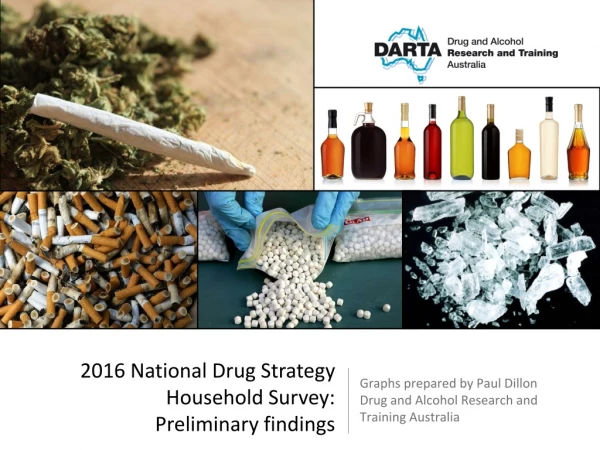
Graphs prepared by Paul Dillon Drug and Alcohol Research and Training Australia. 2013 National Drug Strategy Household Survey: Preliminary findings. Lifetime illicit drug use (%) - 14 years and over 2013 National Drug Household Survey. %.

E N D
Graphs prepared by Paul Dillon Drug and Alcohol Research and Training Australia 2013 National Drug Strategy Household Survey: Preliminary findings
Lifetime illicit drug use (%) - 14 years and over2013 National Drug Household Survey %
Never used illicit drugs (%) - 14 years and over2013 National Drug Household Survey %
Recent illicit drugs (%) - 14 years and over2013 National Drug Household Survey %
Recent not used illicit drugs (%) - 14 years and over2013 National Drug Household Survey %
Lifetime illicit drug use (%) - 14 years and overComparison 2010-2013 2013 National Drug Household Survey %
1991-2013: Changes in 'recent use' (%)2013 National Drug Household Survey %
Recent use of illicit drugs, people aged 14 years or older, by age, 1995-20132013 National Drug Household Survey %
Tobacco 2013 NDSHS
Tobacco smoking status, people aged 14 years or older, 1991-2013 2013 National Drug Household Survey %
Tobacco smoking status, people aged 14 years or older, 1991-2013 2013 National Drug Household Survey %
Alcohol 2013 NDSHS
Alcohol drinking status: proportion of the population aged 14 years or over (1991-2013) 2013 National Drug Household Survey Between 1991 and 2013, for Australians aged 14 years or older, alcohol consumption patterns remained largely unchanged – less than weekly, ex-drinkers and never drinking increasing %
Cannabis 2013 NDSHS
How have things changed? Lifetime and recent cannabis use, 1993-2013 2013 National Drug Household Survey %
Ecstasy 2013 NDSHS
How have things changed? Lifetime and recent ecstasy use (%), 1991-20132013 National Drug Household Survey %
Meth/amphetamine 2013 NDSHS
How have things changed? Lifetime and recent meth/amphetamine use, 1993-2013 2013 National Drug Household Survey %
2007-2013: Form of meth/amphetamine used, recent users aged 14 years or over2013 National Drug Household Survey % Although use of meth/amphetamine remained relatively stable since 2007 (i.e., the number of amphetamine users had not increased), those who did use were far more likely to now use the crystalline form of the drug – 'ice'
Cocaine 2013 NDSHS
How have things changed? Lifetime and recent cocaine use, 1993-2013 2013 National Drug Household Survey %
Hallucinogens The term 'hallucinogens' includes synthetic and naturally occurring hallucinogens (acid, trips, mushies, magic mushrooms, blotter, angels trumpet and blue meanies) 2013 NDSHS
How have things changed? Lifetime and recent hallucinogens use, 1993-2013 2013 National Drug Household Survey %
Pharmaceuticals and over-the-counter medications Non-medical purposes - "in ways that induced or enhanced a drug experience" (AIHW, 2011) 2013 NDSHS
Recent use of pharmaceuticals for non-medical purposes, people aged 14 years or older, by age and sex, 2013 2013 National Drug Household Survey %
Recent use of OTC and prescription pain-killers, recent users aged 14 years or older, by age and sex, 2013 2013 National Drug Household Survey %
Changes in 'lifetime use' (misuse of pharmaceuticals – i.e., for non-medical purposes), 1995-20132013 National Drug Household Survey %
Changes in 'recent use' (misuse of pharmaceuticals – i.e., for non-medical purposes), 14-19 year olds, 1995-20132013 National Drug Household Survey %