Download
1 / 32
320 likes | 432 Views
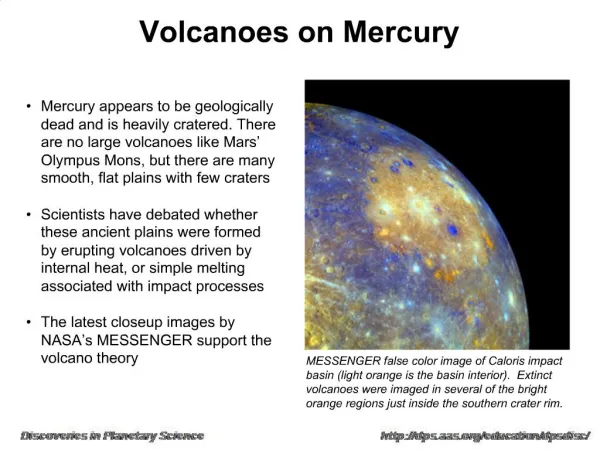
Mercury Assessment on Duck Valley Indian Reservation. Shoshone-Paiute Tribes June 3, 2008. The Shoshone-Paiute Tribes currently have a fish consumption advisory on the 3 reservoirs on DVIR.

E N D
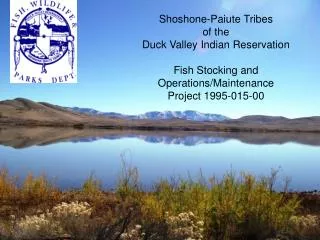
Mercury Assessment on Duck Valley Indian Reservation Shoshone-Paiute Tribes June 3, 2008
The Shoshone-Paiute Tribes currently have a fish consumption advisory on the 3 reservoirs on DVIR
Results of the Fish sampling event in 2007 determined the need for the limited consumption advisory
Limited funding in previous years 2006 Study by UNR researchers found elevated levels of Mercury in fish collected at Wild Horse reservoir, indicating a possible problem for Tribal fisheries Increased Awareness of the risks of Hg exposure to human health and the environment Me-Hg is much more toxic than inorganic Hg Toxic levels affect the immune, genetic, enzyme and neurological systems Otters and other fish eating mammals are also affected Possible financial losses due to decrease of fishing license sales on Tribal lakes Timing for the Tribe’s involvement on Mercury assessment – Why now?
Sample Collection –The Tribes and USGS cooperated on a Mercury assessment in Fish sampling event in May 2007 • 15 Rainbow Trout were collected from Mountain View, Billy Shaw and Sheep Creek Reservoirs • 15 Rainbow Trout were collected from Wild Horse reservoir that is the initial catchment water-body of the East Fork of the Owyhee River • 5 Rainbow Trout were collected from the Hatchery transport just previous to release for stocking
Laboratory Analysis • Fillet samples were delivered to the USGS Mercury Laboratory in Middleton, Wisconsin • Samples were analyzed for Total Mercury
Data Handling • Data results were returned from the Lab to USGS co-operator • USGS delivered data results to the Shoshone-Paiute Tribes
Data Analysis • Decision was made by Tribal Hg workgroup to obtain a Toxicologist for evaluation of the data • It was decided that the Idaho department of Health and Welfare Toxicologist interpret the data
The IHW toxicologist recommended that the Tribes issue a Limited consumption advisory Idaho department of Environmental Quality has established 0.3 ppm of Hg concentration as fish tissue criterion Nevada has an advisory limit of 1.0 ppm Information Utilization
Information Utilization (cont.) • USGS with Tribal input posted a News release on December 7, 2007 • Newspapers (Idaho Statesman, Seattle Post-Intelligencer and others) feature articles on consumption advisory • Tribal Environmental program submits consumption advisory to local Sho-Pai Newspaper
Global atmospheric sources Regional Sources Atmospheric deposition from nearby industrial sources Natural occurrence Sources from Historic mining activity within the watershed Tribal Mercury workgroup researches possible causes of elevated Hg concentration in fish
Results of Tribal research found that • In 2005, EPA modeled Hg deposition according to speciation on the upper Owyhee, Bruneau and Salmon Falls watersheds • Sources of deposition were Northern NV Gold mines
EPA 2001 Emission Data from nearby Gold mines were used as modeling support
% Elemental % Divalent Gaseous (Reactive Gas) % Particle bound RGM is known to quickly deposit in watersheds downwind from the source Elemental Hg becomes part of the global pool for 1-2 years The Gold mines were modeled using the Clean Air Mercury rule The model relies on default stack parameters that are not very realistic Grey color in pie charts is background contribution Light Blue color in pie charts is Nevada Gold Mines contribution Mercury deposition to watersheds from nearby Gold mines by speciation
Mercury Deposited to Idaho Watersheds - Nevada Gold Mine Mercury Speciation of 100% Hg0, 0% Hg2, 0% HgP
Mercury Deposited to Idaho Watersheds - Nevada Gold Mine Mercury Speciation of 99% Hg0, 1% Hg2, 0% HgP
Mercury Deposited to Idaho Watersheds - Nevada Gold Mine Mercury Speciation of 95% Hg0, 5% Hg2, 0% HgP
Mercury Deposited to Idaho Watersheds - Nevada Gold Mine Mercury Speciation of 90% Hg0, 5% Hg2, 5% HgP
Mercury Deposited to Idaho Watersheds - Nevada Gold Mine Mercury Speciation of 90% Hg0, 10% Hg2, 0% HgP
Mercury Deposited to Idaho Watersheds - Nevada Gold Mine Mercury Speciation of 70% Hg0, 30% Hg2, 0% HgP
Mercury Deposited to Idaho Watersheds - Nevada Gold Mine Mercury Speciation of 70% Hg0, 25% Hg2, 5% HgP
According to scientists, Jerrit Canyon Mine was emitting 80-90% RGM Jerrit Canyon Mine emitted 4,200 lbs. of RGM and 10,700 lbs. of total mercury in 2006 Roasting ore began in ‘95 NDEP ordered the shutdown of the Jerrit Canyon Ore roasters in March 2008 EPA has recently revised modeling that depicts the mine contributions of Mercury using updated stack test results from the Nv MACT (Nevada Maximum achievable control technology) program and will be available in the near future. Information on nearby Gold mines
What is methymercury? • Me-Hg is produced by sulfate reducing bacteria that live in oxygen depleted sediments, primarily at the bottom of lakes, reservoirs and wetlands • The bacteria uptake inorganic mercury and convert it Me-Hg by biochemical reaction • Me-Hg moves up the aquatic food chain while biomagnifying and bioaccumulating • Most of the Mercury found in fish, particularly large predator fish is Me-Hg
It has been difficult to establish and predict the effect of Hg deposition on the Me-Hg concentrations in Fish This uncertainty likely has lead to indifference to change of practices by Hg pollution contributors Methylation is strongly affected by Organic carbon pH Sulfur Selenium Water temperature Factors in Methylation
METAALICUS (The Hg experiment to assess Atmospheric loading in Canada and the U.S.) Study. 2007. Conducted in NW Ontario, Canada NCAR Studies on Hg released from topsoil and vegetation during Wildfire MET - Study showed direct response of Me-Hg concentration in fish solely due to addition of enriched stable Hg isotopes MET – [Me-Hg] in Fish increased relatively rapidly to changes in Hg deposition on the lake surface Significant studies
Assess Hg concentration in Fish on the East Fork of the Owyhee River Rainbow Trout and/or Smallmouth Bass At least 15 fish of multiple age classes August 2008 Assess Hg deposition and methylation in reservoirs on DVIR Tentatively scheduled for 2009 Collection and analysis of Hg concentrations in Sediment and water Future SPT Hg assessment projects
Sources of Information • Nevada Department of Environmental Protection (NDEP) • Unites States Environmental Protection (EPA) • United States Geological Survey (USGS) • Idaho Department of Environmental Quality (IDEQ) • National Service for Atmospheric Research (NCAR) • Tribal Wildlife, Parks and Fisheries program
Power Point by John CrumWater Quality Coordinator • Shoshone-Paiute Tribes • P.O. Box 219 • Owyhee, Nevada 89832 • (208) 759-3100 extension 256 • E-mail: ShoPaiTr6@aol.com