Download
1 / 5
50 likes | 54 Views
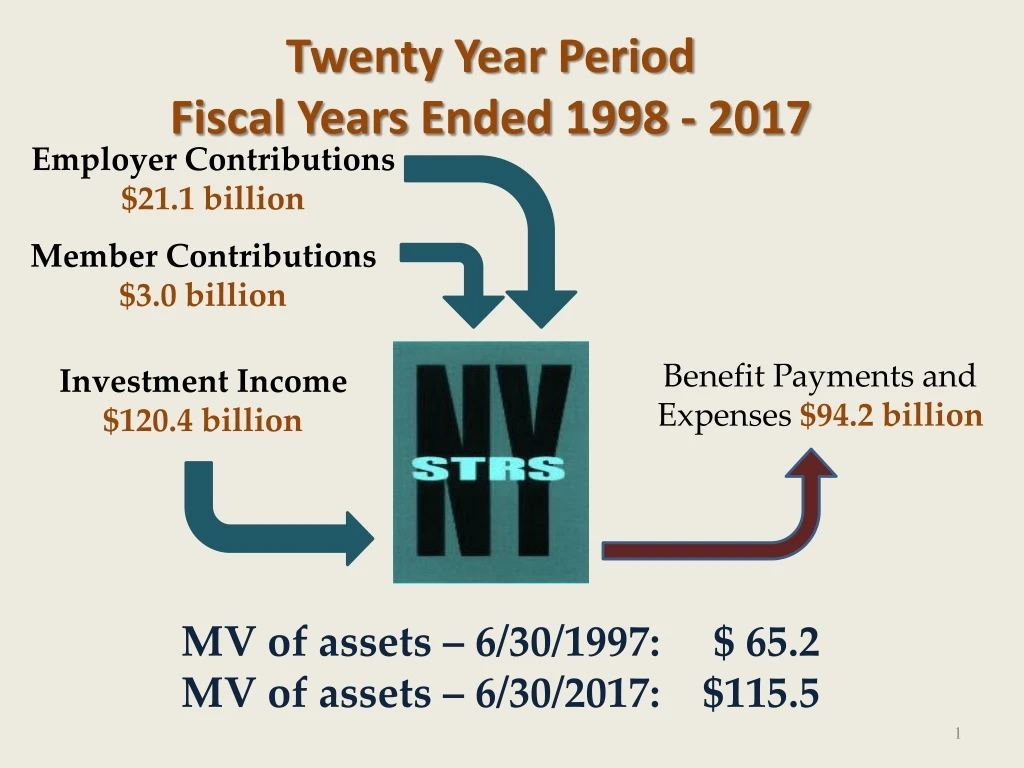
Twenty Year Period Fiscal Years Ended 1998 - 2017. Employer Contributions $21.1 billion. Member Contributions $3.0 billion. Benefit Payments and Expenses $94.2 billion. Investment Income $120.4 billion. MV of assets – 6/30/1997: $ 65.2 MV of assets – 6/30/2017: $115.5.

E N D
Twenty Year PeriodFiscal Years Ended 1998 - 2017 Employer Contributions $21.1 billion Member Contributions $3.0 billion Benefit Payments and Expenses$94.2 billion Investment Income $120.4 billion MV of assets – 6/30/1997: $ 65.2 MV of assets – 6/30/2017: $115.5
Funded Ratio Market Value of Assets (MVA): the value of fund assets as they would trade on an open market on that date Actuarial Value of Assets (AVA): the value of assets as used in the actuarial valuation which reflects a 5-year smoothing of investment gains and losses
Great Recession Impact Market Value of Assets 9/30/2007 $106 B Market Value of Assets 06/30/2017 $115.5 B Market Value of Assets 3/31/2009 $68 B 5