Download
1 / 15
150 likes | 156 Views
This report provides information on the utilization of the Health Safety Net Trust Fund for Fiscal Year 2017, including the number of persons billed, total dollar amount billed, recipient demographics, services paid for, and funds disbursed to hospitals and community health centers.

E N D
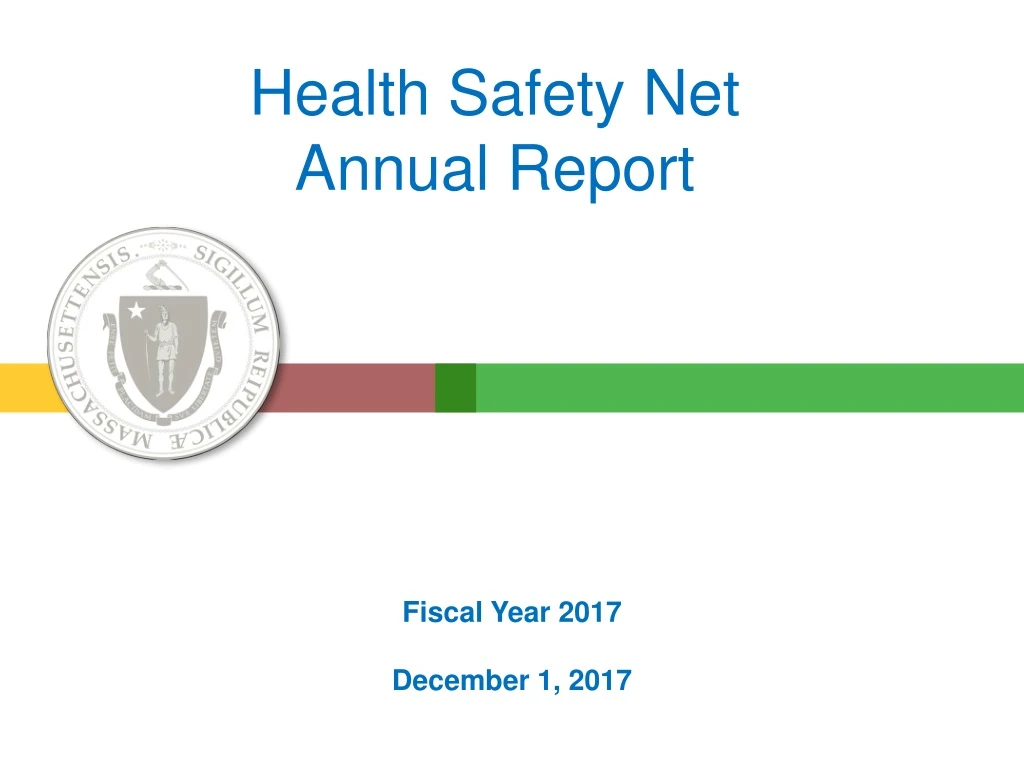
Health Safety NetAnnual Report Fiscal Year 2017 December 1, 2017
Table of Contents Executive Office of Health and Human Services
Executive Office of Health and Human Services Introduction Introduction • The Executive Office of Health and Human Services (EOHHS) hereby submits this report to the Massachusetts Legislature in compliance with Chapter 47 of the Acts of 2017, Line Item 4000-0300, which calls for EOHHS to report on the utilization of the Health Safety Net Trust Fund, including the following information for Fiscal Year 2017: • The number of persons whose medical expenses were billed to the Health Safety Net Trust Fund. • The total dollar amount billed to the Health Safety Net Trust Fund. • The age, income level, and insurance status of recipients using the Health Safety Net Trust Fund. • The types of services paid for out of the Health Safety Net Trust Fund. • The amount disbursed from the Health Safety Net Trust Fund to each hospital and community health center. • This report reflects Health Safety Net (HSN) utilization during HSN fiscal year 2017 (HSN17), which ran from October 1, 2016 through September 30, 2017.
Executive Office of Health and Human Services Introduction HSN Overview • The Health Safety Net (HSN), created by Chapter 58 of the Acts of 2006, makes payments to hospitals and community health centers for health care services provided to low-income Massachusetts residents who are uninsured or underinsured. • Massachusetts residents who are uninsured or underinsured and have incomes up to 150% of the Federal Poverty Level (FPL) may qualify for HSN primary or HSN secondary. • If residents have incomes above 150% and up to 300% of the FPL, they may qualify for primary partial HSN or secondary partial HSN, which includes a sliding scale deductible based on income. • Low income residents who are enrolled in MassHealth, Medicare or other insurance may qualify for HSN secondary for certain services not covered by their primary insurance. • Individuals eligible for ConnectorCare (regardless of enrollment) are eligible for HSN for the first 100 days of eligibility, after such time they are eligible for HSN dental only. • If a Massachusetts resident has allowable medical expenses that exceed a certain percent of their countable income, they may qualify for Medical Hardship, in which case the HSN would pay for HSN qualified services. Individuals who qualify for Medical Hardship must pay a required contribution, based on their family’s countable income.
Executive Office of Health and Human Services Introduction HSN Overview • The HSN pays acute hospitals and community health centers based on services that are eligible for payment. HSN payment rates for most services are based on Medicare payment principles. • HSN17 funding included the following sources: • An assessment on acute hospitals’ private sector charges • A surcharge on payments made to hospitals and ambulatory surgical centers by HMOs, insurers, third party administrators, and individuals (assessment and surcharge are each equal to $160 million plus 50% of the estimated cost of administering the Health Safety Net) • Offset funding for uncompensated care from the Medical Assistance Trust Fund ($70 million). The assessment and surcharge for HSNFY17 were $165.3M each.
Executive Office of Health and Human Services Introduction HSN Fiscal Year 2017 Updates • The HSN shortfall decreased from $111M during HSN16 to $23M during HSN17. • The HSN implemented additional billing enhancements to comply with HSN billing rulesand align with other MassHealth standard billing practices. • The administration of the HSN Dental program transitioned from the HSN to DentaQuest as of January 1, 2017. DentaQuestnow processes dental claims on behalf of the HSN and provides customer service for HSN dental providers. • HSN received and transferred $257.5M to the Delivery System Reform Incentive Program (DSRIP) fund as required by Section 139 of Chapter 133 of the Acts of 2016 (the fiscal year 2017 state budget).
Demand represents the amount that providers would have been paid in the absence of a funding shortfall. Health Safety Net fiscal year 2017 (HSN17) demand exceeded HSN17 funding. Hospital providers experienced a $23 million shortfall during HSN17. The HSN shortfall decreased from $111M during HSN16 to $23M during HSN17. Executive Office of Health and Human Services Payments HSN Total Demand and Payment Trends +3% Demand -15% Demand -14% Payments +6% Payments Payments $403M Payments $345M Payments $366M Notes: The Health Safety Net fiscal year runs from October 1 through September 30 of the following year. Hospital and community health center payments are reported in the month in which payment was made. The shortfall amount is based on spending assumptions in place during the fiscal year and may differ from year-end shortfall estimates reported elsewhere. Data reflect payment and projected demand levels as of the end of each fiscal year and exclude adjustments made after the end of the fiscal year. Numbers are rounded to the nearest million and may not sum due to rounding; percent changes are calculated prior to rounding. Source: Health Safety Net Payment Calculation as of 10/31/17.
Executive Office of Health and Human Services Payments Amounts Disbursed to Hospitals from the Health Safety Net Trust Fund (after Shortfall) This represents the amount disbursed from the Health Safety Net Trust Fund to each Hospital during HSN fiscal year 2017. Data reflects amount disbursed based on claims that have been submitted as of the date of this report. Remediated claims for dates of service in fiscal year 2017 will be paid in subsequent fiscal years. Notes: This list does not include disbursements to Cambridge Health Alliance (CHA) due to offset funding to CHA for uncompensated care from other sources. The Health Safety Net fiscal year runs from October 1 through September 30 of the following year. Hospital payments are reported in the month in which payment was made. The shortfall amount is based on spending assumptions in place during the fiscal year and may differ from year-end shortfall estimates reported elsewhere. Data reflect as of the end of each fiscal year and exclude adjustments made after the end of the fiscal year. Source: Health Safety Net Payment Calculationas of 10/31/17.
Executive Office of Health and Human Services Payments HSN Amounts Disbursed to Community Health Centers This represents the amount disbursed from the Health Safety Net Trust Fund to each Community Health Center during HSN fiscal year 2017. Data reflects amount disbursed based on claims that have been submitted as of the date of this report. Remediated claims for dates of service in fiscal year 2017 will be paid in subsequent fiscal years. Notes: The Health Safety Net fiscal year runs from October 1 through September 30 of the following year. Community health center payments are reported in the month in which payment was made. Data reflect payment as of the end of each fiscal year and exclude adjustments made after the end of the fiscal year. Source: Health Safety Net Payment Calculation as of 10/26/17.
Executive Office of Health and Human Services Service Patterns Service Patterns Hospital Demand by Type of Service Notes: The Health Safety Net fiscal year runs from October 1 through September 30 of the following year. Hospital inpatient excludes pharmacy claims. Hospital inpatient payments are reported in the month in which the service was provided. Source: Health Safety Net Data Warehouse and Health Safety Net Payment Calculation as of 11/8/17.
Executive Office of Health and Human Services Service Patterns Service Patterns HSN CHC Demand by Type of Service Notes: The Health Safety Net fiscal year runs from October 1 through September 30 of the following year.Source: Health Safety Net Payment Calculation as of 11/3/17.
User Demographics In Health Safety Net fiscal year 2017 (HSN17), the non-elderly adult population (ages 19 to 64) accounted for 72% of hospital volume and 78% of hospital demand. Because the Health Safety Net (HSN) is a secondary payer for low-income Medicare patients, adults ages 65 and older accounted for 25% of hospital volume and 19%of hospital demand. Executive Office of Health and Human Services HSN Hospital Utilization and Demand by Age Ages 0-18 Ages 19-26 Ages 65 and Older Ages 45-64 Ages 27-64 Ages 27-44 Ages 65 and older Ages 19-26 Ages 0-18 Notes: The Health Safety Net fiscal year runs from October 1 through September 30 of the following year. Hospital volume is the sum of inpatient discharges and outpatient visits reported in the month in which the service was provided. Hospital volume excludes outpatient pharmacy claims. Hospital payments are reported in the month in which the service was provided. Hospital demand represents the amount that providers would have been paid in the absence of a funding shortfall and excludes outpatient pharmacy. Numbers are rounded to the nearest percent and may not sum to 100% due to rounding. Source: Health Safety Net Data Warehouse as of 11/2/2017.
Executive Office of Health and Human Services Service Patterns Service Patterns HSN Hospital Utilization by Federal Poverty Level (FPL) Notes: The Health Safety Net fiscal year runs from October 1 through September 30 of the following year. HSN pays facilities based on the year the claim was received, some claims paid in FY17 were for individuals eligible for HSN FY16 eligibility rules (up to 400% FPL)Source: Health Safety Net Data Warehouse as of 11/2/17.
Utilization The Health Safety Net (HSN) estimates it will have made payments for medical and dental services provided to 288,000 individuals in HSN17. The total number of HSN17 patientsis estimated based on current claims data and historical claims experience. A portion of claims for HSN17 dates of service have not yet been submitted. These claims may represent unique patients that are not included in these figures. Executive Office of Health and Human Services HSN Total User Trends Notes: The Health Safety Net fiscal year runs from October 1 through September 30 of the following year. Users who receive a service in more than one setting (hospital, community health center) or from more than one payment type (low income patient, emergency bad debt) are counted only once. Due to claim lag there may be unique users not yet accounted for. Users are reported on claims for which payments were made to hospital and community health center providers based on date of service. Numbers are rounded to the nearest thousand; percent changes are calculated prior to rounding. Source: Health Safety Net Data Warehouse as of 11/2/2017.
Executive Office of Health and Human Services HSN Hospital Utilization and Demandby Insurance Status Notes: The Health Safety Net fiscal year runs from October 1 through September 30 of the following year. Hospital volume is the sum of inpatient discharges and outpatient visits reported in the month in which the service was provided. Hospital volume excludes pharmacy claims. Hospital payments are reported in the month in which the service was provided. Hospital demand represents the amount that providers would have been paid in the absence of a funding shortfall and excludes outpatient pharmacy. Numbers are rounded to the nearest percent and may not sum to 100% due to rounding. Data does not include HSN partial as there is no current edit identificationfor primary and secondary insurance on partial payments. Source: Health Safety Net Data Warehouse as of 11/2/2017.