Download
1 / 19
190 likes | 268 Views
The Physical Stimulus: Spatial pattern. (This is a poorly-generated approximation to a sine wave). The Physical Stimulus: Spatial pattern. Why are we interested in the visual system’s response to sine waves? When you know the response to individual sine waves you can, if the

E N D
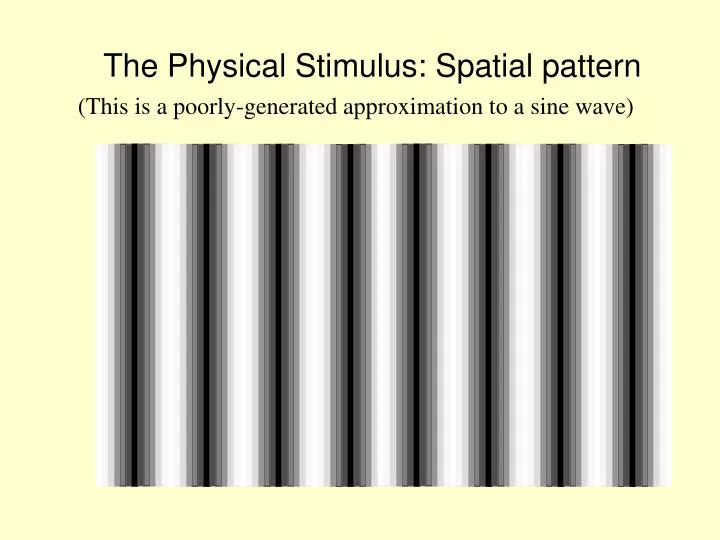
The Physical Stimulus: Spatial pattern (This is a poorly-generated approximation to a sine wave)
The Physical Stimulus: Spatial pattern Why are we interested in the visual system’s response to sine waves? When you know the response to individual sine waves you can, if the system is ‘linear’, determine the response to the complete pattern. Remember the Fourier analysis tutorial. We can think of the limbs of the letter E as being a ‘square wave’ - and, as you know, this can be generated by adding together a series of sine waves.
The Physical Stimulus: Spatial pattern photometer
(contrast) Position N.B. The (spatial) frequency = 1/period For vision, this is measured in cycles per degree
Spatial (Threshold [foveal] Performance) Pattern not seen 1 Modulation Visual Acuity. (i.e.reciprocal contrast) Pattern seen (100%) Spatial Frequency
The following slide allows you to view your own contrast sensitivity function. Try viewing it at different distances, and you’ll see the appearance change. Also, you may see inconsistencies at the extreme right of the figure. This is termed ‘aliasing’ and occurs because the pixel nature of the screen does not allow perfect reproduction of the picture.
Seeingyour own CSF Spatial Frequency Contrast
The Measurement of Spatial (foveal) Visual Performance Contrast sensitivity is a relatively new way of assessing vision The more traditional way is to use an Optometrist’s test chart, which contains letters of different sizes.
H VF ETP NUFCOK UTFEVNP 60 36 24 12 6 Letter Size (explained on the next slide)
The Measurement of Spatial (foveal) Visual Performance The letter size is specified by the distance at which the complete letter subtends 5 mins of arc. The detail subtends 1 min arc. . 6 metres 12 metres
The Measurement of Spatial (foveal) Visual Performance 6 6 Vision - the ability to read the 6 metre letter at a distance of 6 metres (USA - 20 feet) hence 20 20 Minimum angle of resolution (MAR) here is 1 minute of arc
The Measurement of Spatial (foveal) Visual Performance Minimum angle of resolution (MAR) here is 1 minute of arc A recent development is to use as a metric the logarithm of this angle - logMAR scale (Bailey and Lovie) 6/6 = 1 minute arc => log 1 = 0 6/12 = 2 minutes arc => log 2 = 0.3 6/60 = 10 minutes arc => log 10 = 1 Measured this way, the logMAR scale is, arguably, at an interval level - hence one can perform parametric statistical analysis on data obtained using this test.
H V F E T P N U F C O K F V U P L N P N P U L B E V The following are letter charts which have decreasing contrast. 1 2 3 4 5 6
E H F E T P N U F C O K P L N F V U L L B E V N P U 1 2 3 4 5 6
P H E V E T P N U F C O K E V U T F N P E V N L B P U 1 2 3 4 5 6
P H E V E T P N U F C O K E V U T F N P E V N L B P U This is a high-contrast version of the previous chart. 1 2 3 4 5 6
Compare: E E smaller higher Letter Size Spatial Frequency
The Optometrists chart will generally only contain high-contrast letters. These provide maximum acuity. As you will see from the following graph, one would predict that lower contrast letters would produce a lesser visual performance.
Contrast Sensitivity 0.1% Pattern not seen 1% Pattern seen Contrast 10% 100% Spatial Frequency Cut-off