Download
1 / 18
180 likes | 308 Views
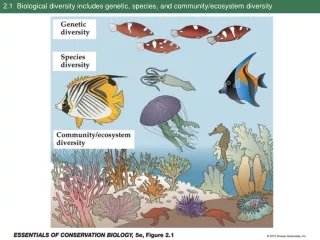
Mapping genetic and taxonomic species diversity at regional and continental scales. Shawn Laffan. Sophie Bickford. CSIRO Centre for Plant Biodiversity Research. Species Diversity. Conservation prioritisation Evolution & dispersion These are geographic phenomena multi-scaled

E N D
Mapping genetic and taxonomic species diversity at regional and continental scales Shawn Laffan Sophie Bickford CSIROCentre for Plant Biodiversity Research
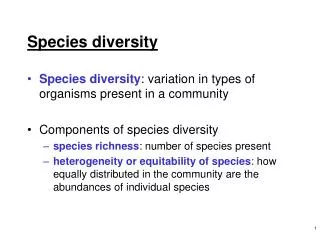
Species Diversity • Conservation prioritisation • Evolution & dispersion • These are geographic phenomena • multi-scaled • expensive to directly sample • Need a source of data
Museum data • Rich source of geocoded information • 6 million plant specimens in Australian Herbaria • Australian Virtual Herbarium – approx. 40% digitised in 2002 • every specimen description has a geographic coordinate or reference • No true absence data • Variable sampling effort
Data set • Genus Pultenaea • Eastern Australian species used • 91 species • 3 clades used • Genetic similarity data for 49 species • Aggregated to 50 km resolution • reduce effects of variable sampling effort & roadmap effect • Lambert’s conic conformal projection • 5799 samples (after aggregation)
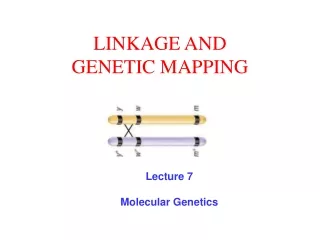
Genetic diversity • Use of a taxonomy assumes it is reliable • but taxonomy is constantly revised • implies equal similarity between all species • If we know the genetic similarity of species then we can soften the effects of taxonomy • number of base pairs in common • two sections of trnL-F and ndhF chloroplast genes • base pairs: 900 trnL-F, 674 ndhF • matrix of similarities
Genetic diversity • We know where the species occur • we can therefore map genetic variation • useful for evolutionary history • Explicitly spatial: • mean and coefficient of variation of genetic similarity between all species within a local neighbourhood • Implicitly spatial • agglomerative clustering with average genetic similarity as similarity metric
Local genetic diversity by clade Local genetic diversity, all species
Implicitly spatial • Agglomerative clustering of cells • Allows for disjoint distributions • Taxonomic similarity metric between two cells: • Jaccard distance • Shared presence divided by total number of species in two cells • a / (a + b + c) • a Num species occurring in both cells • b & c Num species occurring in only one cell
ACT Brumbies B. greganii B. larkhamii B. gitaeuii B. mortlockii B. rathboneii B. gerardii B. roffii Australian Wallabies B. greganii B. larkhamii R. flatleyii B. mortlockii W. tuqirii R. sailorii W. rogersii Jac = 3 / (3 + 4 + 4) = 3 / 11 = 0.27
Agglomerative clustering – linkage heuristic • Similarity of newly aggregated classes: • Unweighted Pair-Group Method • UPGM-A • average similarity of merged classes • common species counted more than once • “staircase” effect • UPGM-R • recalculate similarity matrix from first level • each species counts only once in each merger
Average Linkage Recalculated Linkage Similarity Similarity
What next? • Cross-validation for genetic analyses • More sophisticated measures of genetic similarity • able to cope with more diverse groups • mean & CofV not ideal measures for non-symmetric distributions • Software distribution / web analysis service • http://www.biodiverse.unsw.edu.au