Download
1 / 29
340 likes | 496 Views
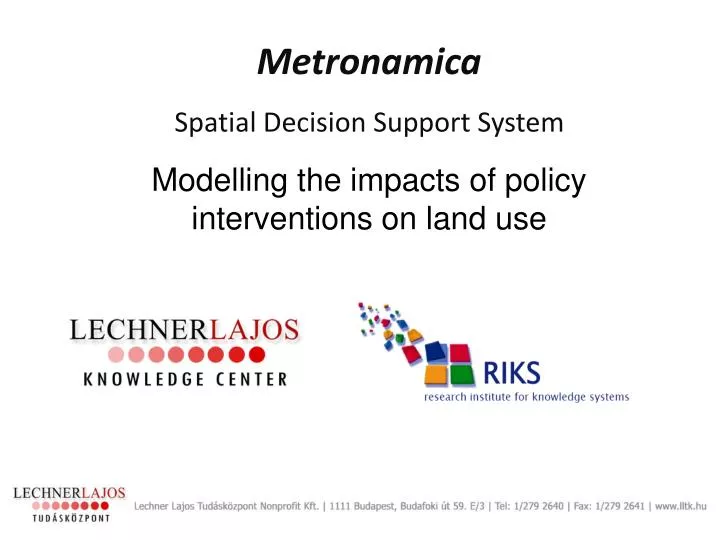
Metronamica Spatial Decision Support System Modelling the impacts of policy interventions on land use. Land use change over time…. Land use dynamics are complex and have self organising behaviour Planners and policy-makers have a decisive influence on future land use. 2.

E N D
Metronamica Spatial Decision Support System Modelling the impacts of policy interventions on land use
Land use change over time… • Land use dynamics are complex and have self organising behaviour • Planners and policy-makers have a decisive influence on future land use 2
Spatial Decision Support System aims to: • Improve the understanding of the reciprocal relationship between various processes • Assess the spatial implications of (a combination of) policy measures under different socio-economic scenarios RIKS 3
The approach to modelling • Simulation models: start with a state (e.g. land use map of the initial year) and use a set of drivers (behavioural, institutional and physical) to calculate future developments • Exploratory approach: show what could happen, rather than what should happen • No ideal future, nor is there an assumption that the world reaches equilibrium in any point in time • Complexity theory • An organized but unpredictable behaviour of the land use system – self organisation • Large set of simple equations or rules that together create a complex behaviour • Non-linear dynamics and emergent properties 4
Understand the Process • Understand the process by which cities and regions change • Capture the process in a dynamic model • Use the model to experiment with the future: • Explore various scenarios • Test policy and planning options before they are implemented 5
FUTURE NOW PAST Developing and using the model Unknown future Known history Land Use Facts on:SuitabilityZoningAccessibilityPopulationJobs Land Use Scenarios on:SuitabilityZoningAccessibilityPopulationJobs Land Use Facts on:SuitabilityZoningAccessibilityPopulationJobs Observed /HistoricalChanges Scenarios /Forecasts on Spatial Claims Exploration Calibration
Drivers of land use change • Land use demands (model at regional level) • Current land use and spatial interaction • Zoning regulations • Suitability of the location • Accessibility 7
Drivers of land use change • Land use demands (model at regional level) • Current land use and spatial interaction • Zoning regulations • Suitability of the location • Accessibility 9
Neighborhood influence • Neighbourhood influence rules express • Push and pull forces (repulsion and attraction between pairs of land uses) • Agglomeration effects • Inertia • Neighbourhood influence rules are robust, and tend to be quite similar from one application to another.
RIKS’ Cellular Automata Land use Model Distance rules representing locational preferences of land uses in competition for space Commerce Housing Water Industry Forest • 25-1000 m resolution; Commerce (White & Engelen, 1993; 1997) Industry Housing 11
Drivers of land use change • Land use demands (model at regional level) • Current land use and spatial interaction • Zoning regulations • Suitability of the location • Accessibility 12
Zoning regulation • Facilitating map: plans that explicitly allow certain land use developments. (e.g. urban expansion plans) • Restrictive map: policy documents that explicitly prohibit certain developments. (e.g. protected natural areas, which is forbidden to start new industry developments). • De facto land use: the land use that is already there. (e.g. residential land use on the map this location would be restricted by the regulations of the protected natural areas). 13
Zoning regulation: interpretationSet hierarchy and interpretation Plans are interpreted per category Start date End date 14
combined results of all plans Combination (Hierarchy) National parks T=2011 Natura 2000 Risk for excess water Interpretation 15
Drivers of land use change • Land use demands (model at regional level) • Current land use and spatial interaction • Zoning regulations • Suitability of the location • Accessibility 16
Suitability • Suitability qualifies the effect that physical elements of the land have on the possible future occurrence of land uses on a certain location. • Suitability represents the physical aspects of a location (information on soil, elevation, slope etc). 17
Steps of setting factor map Suitability of mixed and coniferous forests according to elevation Elevation Interpretation: 18
Select combination method Aspect f(x) Elevation Suitability according to all factors combined Slope Interpretation Combination 19
Drivers of land use change • Land use demands (model at regional level) • Current land use and spatial interaction • Zoning regulations • Suitability of the location • Accessibility 20
Accessibility • Accessibility is the influence of infrastructure. • Accessibility is different for each land use. 21
Land use Suitability & Interaction weights & & Accessibility Total Potentials Zoning = & Transition Rule Change cells to land-use for which they have the highest transition potential until the land use demands are met. Time Loop 23
Aid for: • Recognition • Diagnosis Aid for: • Problem identification • Design of solutions • Exploration of solutions Aid for: • Analysis • Evaluation • Selection • Authorization Policy intervention Value of a policy relevant indicator Policy intervention Policy intervention Alternative 1 Alternative 2 Alternative 3 GOAL Alternative 4 Alternative 5 Alternative 6 Policy intervention Policy intervention PAST PRESENT FUTURE Planning of policy actions
Create scenarios Population and employment trends Land use demands New infrastructure network Regulations and developments zoning
Scenario analysis with Metronamica • Creating integrated master scenarios • Running the model • Options for saving results • Integrated, dynamic, spatial • Visualising results • Indicators • Analysing results • Comparing, analysing, evaluating 26
Analysing results Land use in 2031 according to different scenarios (1) baseline scenario (2) transnational strategic scenario Forest (3) according to the two different scenario
Use of Policy Support Systems • It can help: • Explore dynamic spatial developments using ‘what-if-analysis’ • Visualise consequences of trends, shocks and policy interventions • Stimulates and facilitates • Learning • Awareness building • Discussion 28
Thank you! vaszocsikvilja@lltk.hu