Download
1 / 1
10 likes | 166 Views
MM5- and WRF-Simulated Cloud and Moisture Fields During a Convective Initiation Event. Jason A. Otkin* Cooperative Institute for Meteorological Satellite Studies, University of Wisconsin–Madison. 1. INTRODUCTION. 3. WRF AND MM5 SIMULATION RESULTS. 4. MODEL PRECIPITATION AND RADIATION.

E N D
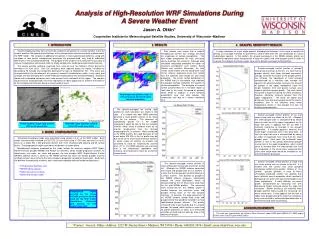
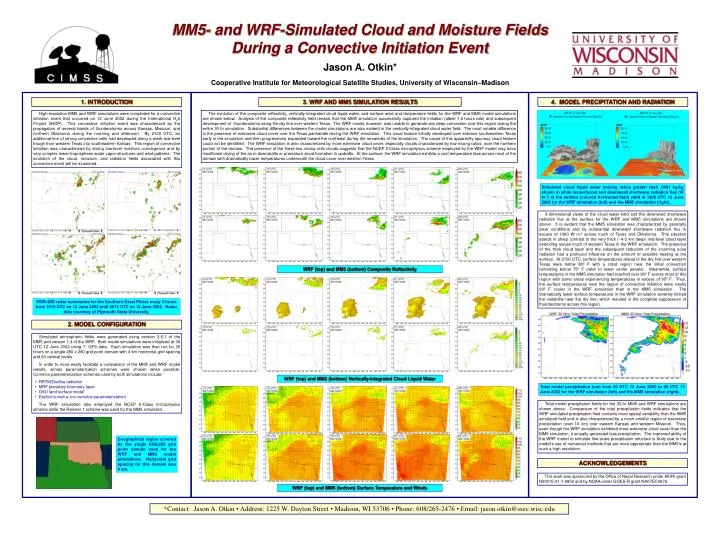
MM5- and WRF-Simulated Cloud and Moisture Fields During a Convective Initiation Event Jason A. Otkin* Cooperative Institute for Meteorological Satellite Studies, University of Wisconsin–Madison 1. INTRODUCTION 3. WRF AND MM5 SIMULATION RESULTS 4. MODEL PRECIPITATION AND RADIATION High-resolution MM5 and WRF simulations were completed for a convective initiation event that occurred on 12 June 2002 during the International H20 Project (IHOP). This convective initiation event was characterized by the propagation of several bands of thunderstorms across Kansas, Missouri, and northern Oklahoma during the morning and afternoon. By 2100 UTC, an additional line of strong convective cells had developed along a weak low-level trough from western Texas into southeastern Kansas. This region of convective initiation was characterized by strong low-level moisture convergence and by very complex lower-tropospheric water vapor structures and wind patterns. The evolution of the cloud, moisture, and radiation fields associated with this convective event will be examined. The evolution of the composite reflectivity, vertically-integrated cloud liquid water, and surface wind and temperature fields for the WRF and MM5 model simulations are shown below. Analysis of the composite reflectivity field reveals that the MM5 simulation successfully captured the initiation (albeit 1-2 hours late) and subsequent development of thunderstorms along the dry line over western Texas. The WRF model, however, was unable to generate any deep convection over this region during the entire 30 hr simulation. Substantial differences between the model simulations are also evident in the vertically-integrated cloud water field. The most notable difference is the presence of extensive cloud cover over the Texas panhandle during the WRF simulation. This cloud feature initially developed over extreme southwestern Texas early in the simulation and then progressively expanded toward the northeast during the remainder of the simulation. The cause of this apparently spurious cloud feature could not be identified. The WRF simulation is also characterized by more extensive cloud cover, especially clouds characterized by low mixing ratios, over the northern portion of the domain. The presence of the these low mixing ratio clouds suggests that the NCEP 5-Class microphysics scheme employed by the WRF model may have insufficient drying of the air in downdrafts or premature cloud formation in updrafts. At the surface, the WRF simulation exhibits a cool temperature bias across most of the domain with dramatically lower temperatures underneath the cloud cover over western Texas. Simulated cloud liquid water (mixing ratios greater than .0001 kg/kg shown in white isosurfaces) and downward shortwave radiation flux (W m-2) at the surface (colored horizontal field) valid at 1800 UTC 12 June 2002 for the WRF simulation (left) and the MM5 simulation (right). 3-dimensional views of the cloud water field and the downward shortwave radiation flux at the surface for the WRF and MM5 simulations are shown above. It is evident that the MM5 simulation was characterized by generally clear conditions and by substantial downward shortwave radiation flux in excess of 1000 W m-2 across much of Texas and Oklahoma. This situation stands in sharp contrast to the very thick (~4-5 km deep) mid-level cloud layer extending across much of western Texas in the WRF simulation. The presence of the thick cloud layer and the subsequent reduction of the incoming solar radiation had a profound influence on the amount of sensible heating at the surface. At 2100 UTC, surface temperatures ahead of the dry line over western Texas were below 80º F with a small region near the initial convection remaining below 75º F (refer to lower center panels). Meanwhile, surface temperatures in the MM5 simulation had reached over 90º F across most of this region with some areas experiencing temperatures in excess of 95º F. Thus, the surface temperatures near the region of convective initiation were nearly 20º F cooler in the WRF simulation than in the MM5 simulation. The dramatically lower surface temperatures in the WRF simulation severely limited the instability near the dry line, which resulted in the complete suppression of thunderstorms across this region. WRF (top) and MM5 (bottom) Composite Reflectivity WSR-88D radar summaries for the Southern Great Plains every 3 hours from 1515 UTC on 12 June 2002 until 0015 UTC on 13 June 2002. Radar data courtesy of Plymouth State University. 2. MODEL CONFIGURATION • Simulated atmospheric fields were generated using version 3.6.1 of the MM5 and version 1.3 of the WRF. Both model simulations were initialized at 00 UTC 12 June 2002 using 1° GFS data. Each simulation was then run for 30 hours on a single 280 x 280 grid point domain with 4 km horizontal grid spacing and 60 vertical levels. • In order to more easily facilitate a comparison of the MM5 and WRF model results, similar parameterization schemes were chosen when possible. Common parameterization schemes used by both simulations include: • RRTM/Dudhia radiation • MRF planetary boundary layer • OSU land surface model • Explicit cumulus (no cumulus parameterization) • The WRF simulation also employed the NCEP 5-Class microphysics scheme while the Reisner-1 scheme was used for the MM5 simulation. WRF (top) and MM5 (bottom) Vertically-Integrated Cloud Liquid Water Total model precipitation (cm) from 00 UTC 12 June 2002 to 06 UTC 13 June 2002 for the WRF simulation (left) and the MM5 simulation (right). Total model precipitation fields for the 30-hr MM5 and WRF simulations are shown above. Comparison of the total precipitation fields indicates that the WRF simulated precipitation field contains more spatial variability than the MM5 simulated field and is also characterized by a much smaller region of excessive precipitation (over 10 cm) over eastern Kansas and western Missouri. Thus, even though the WRF simulation exhibited more extensive cloud cover than the MM5 simulation, it actually generated less precipitation. The improved ability of the WRF model to simulate fine-scale precipitation structure is likely due to the model’s use of numerical methods that are more appropriate than the MM5’s at such a high resolution. Geographical region covered by the single 280x280 grid point domain used for the WRF and MM5 model simulations. Horizontal grid spacing for this domain was 4 km. ACKNOWLEDGEMENTS This work was sponsored by the Office of Naval Research under MURI grant N00015-01-1-0850 and by NOAA under GOES-R grant NA07EC0676. WRF (top) and MM5 (bottom) Surface Temperature and Winds *Contact: Jason A. Otkin • Address: 1225 W. Dayton Street • Madison, WI 53706 • Phone: 608/265-2476 • Email: jason.otkin@ssec.wisc.edu