Download
1 / 29
290 likes | 380 Views
Implications of EU Milk Quota Abolition. Trevor Donnellan & Thia Hennessy Teagasc - Irish Agriculture and Food Development Authority Dublin, Ireland. with Special Emphasis on Ireland. Patrick Westhoff Food and Agricultural Policy Research Institute (FAPRI) University of Missouri, USA.

E N D
Implications of EU Milk Quota Abolition Trevor Donnellan & Thia Hennessy Teagasc - Irish Agriculture and Food Development Authority Dublin, Ireland with Special Emphasis on Ireland Patrick Westhoff Food and Agricultural Policy Research Institute (FAPRI) University of Missouri, USA
Overview • Background • Methodology • Quota Removal • EU15 Aggregate • Ireland National Level • Irish Farm Level • Conclusions
Background • In 1998 FAPRI asked to examine a number of dairy policy options. • Scenarios that would eliminate the EU dairy quota programme • allow EU dairy product prices to fall to market-clearing levels
Methodology • FAPRI used a structural model of the EU dairy sector, • based on assumed elasticities of supply and demand. • analysis enhanced by a panel of dairy industry analyst • reviewed model parameters and preliminary results • challenge was estimating milk supply response • based on estimates of milk production costs and quota values reported in the literature • modified in response to panel comments
Detail of Scenario • In the run-up to Agenda 2000 the study compared EU dairy market projections under two alternative scenarios: • 1) Baseline scenario: continue 1998 policies indefinitely. • 2) Alternative scenario: • eliminated EU dairy quotas and the intervention regime in 2001 • No compensation • GATT limits apply (no new WTO changes) • No intervention • No EU internal subsidised disposal
EU Milk Production • With no quotas, milk production increases • up 5% in 2001 • up 8% in 2007 • Sharply lower prices limit production increase
EU Milk Prices • With no quotas, milk prices decline 20% in the first year • In the seventh year, the decline is 27%
EU Cheese Consumption • Consumption grows under current policies • Lower prices without quotas mean even more cheese consumption
EU Dairy Exports • Lower prices without quotas result in more exports • Export markets absorb about half of the increase in milk production
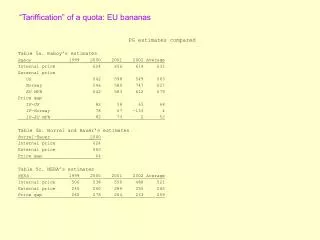
EU and World Butter Prices, 2007 • EU butter prices also fall, but remain above world prices • Thus, EU butter exports would still require subsidies
EU and World SMP prices, 2007 • SMP prices fall to world levels under no quotas • EU can export SMP without subsidy
Quota Elimination Summary • Milk production increases 5-9 percent • Milk prices fall 20-29 percent • Domestic dairy consumption increases • Dairy exports increase 16-41 percent
Events since analysis completed • European Union adopted the Agenda 2000 reforms. • Small increase in quota • Intervention price reductions, 2005-2007 • FAPRI (2000) estimated result would be • Higher production (but increase less than quota increase) • Lower prices (but decrease less than intervention price reduction) • Many other factors have affected dairy markets • Resulting market outcomes for 1998-2001 have differed from 1998 baseline projections
1998 baseline, 1998 no quota scenario, preliminary 2002 baseline weaker price outlook Milk Price 3.7% fat basis
Ireland in EU Context • Ireland has just 4 % of EU15 milk quota • But Ireland only 1 % of EU 15 population • Ireland has a significant dairy product surplus • circa 70% of milk equivalent exported to • EU member states and third countries • Average dairy farm has 38 cows • Milk output per cow low relative to EU average
Milk Output per Cow • Some imponderables to consider • Irish milk output per cow relatively static in last 10 years • Genetic potential increasing but not shown in performance ? • Short lactations ? • 7% of production fed to calves • Why do we have 200,000 surplus dairy cows? • What will be effect of quota removal?
Focus of Irish Product Mix • Butter and SMP dominate the product mix • represent about 60 % of manufacturing milk use • cheese is small in relative terms (20% of manufacturing milk use) • Disproportionate dependence to intervention products
Irish Milk Price and Production • Irish Milk price lower than EU Average • But grass based production system • Lower Costs • Ireland considered to be low in cost relative to some feed grain systems
Geography of Current Production Smaller Farms, Higher Cost • Possible to generalise Ireland into two areas • “South East” segment • lower costs and larger farms • “North West” segment • higher costs smaller farms • Currently quota is ring fenced • prohibits internal migration of production • South East has expansion potential Larger Farms, Lower Cost
Post Quotas what would the future hold? • In no quota situation • the Irish milk price decline would be greater than the EU average • because of unfavourable product mix • small domestic market relative to production • limited access to internal EU Markets • relatively greater dependency on intervention, subsidised disposal and 3rd country markets • Decline in milk price greater than EU average • in the range of 30 to 35 per cent given these factors
Irish Farm Level Analysis Thia Hennessy
The Impact at Farm Level • The focus was on 1. Potential to expand production 2. Expansion required given lower price 3. Feasibility of expansion
Assessing the Production Potential • Latent potential in cow yields and numbers • Shortened Lactation • Level of specialisation in dairy 50 – 60% • Potential increase 35-65% • Largest potential – smallest producer
Impact on Income • Assuming Abolition in 2008 - three scenarios • 20c per litre price & 2.7c compenstation • 20c per litre price & 5.4c compenstation • 22.4c per litre price & 4.2c compenstation • Assume production costs 6-7% higher than present
Is it feasible? • Large investment required • Cash surplus during repayment • Small farms less than minimum wage • Medium group less than industrial wage • Serious implications for farm numbers
Take Home Message • EU • production up 8 % • price down 27 % • Ireland • poor product mix • intervention dependent • price down 30 - 35 % • Ireland Farms • large potential to expand • but not sufficient to maintain income given milk price
Thank You www.tnet.teagasc.ie/fapri Further information on our work is available on our websites at: www.fapri.missouri.edu