Download
1 / 1
10 likes | 92 Views
WAVELET ANALYSIS FOR CONDITION MONITORING OF CIRCUIT BREAKERS. Supervisors: Prof. RE Morrison Brian Lithgow. Author: Dennis Lee CEPE Electrical Power Engineering. INTRODUCTION

E N D
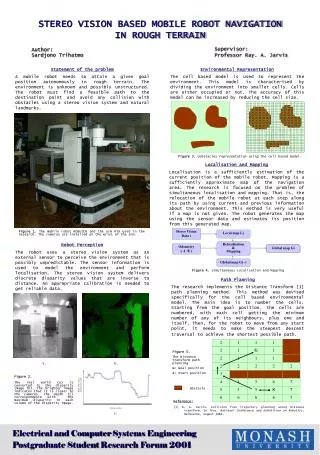
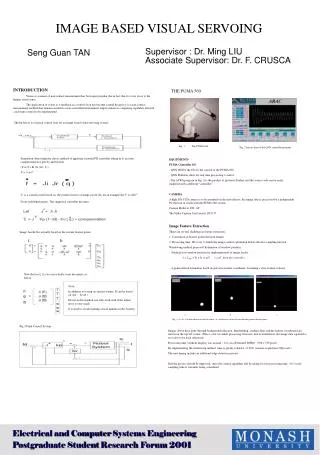
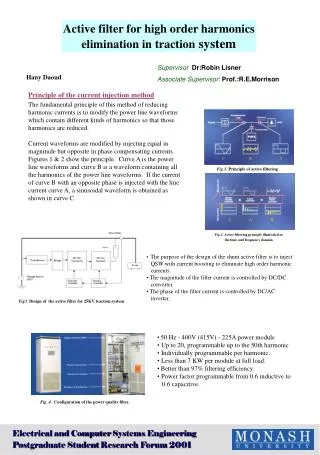
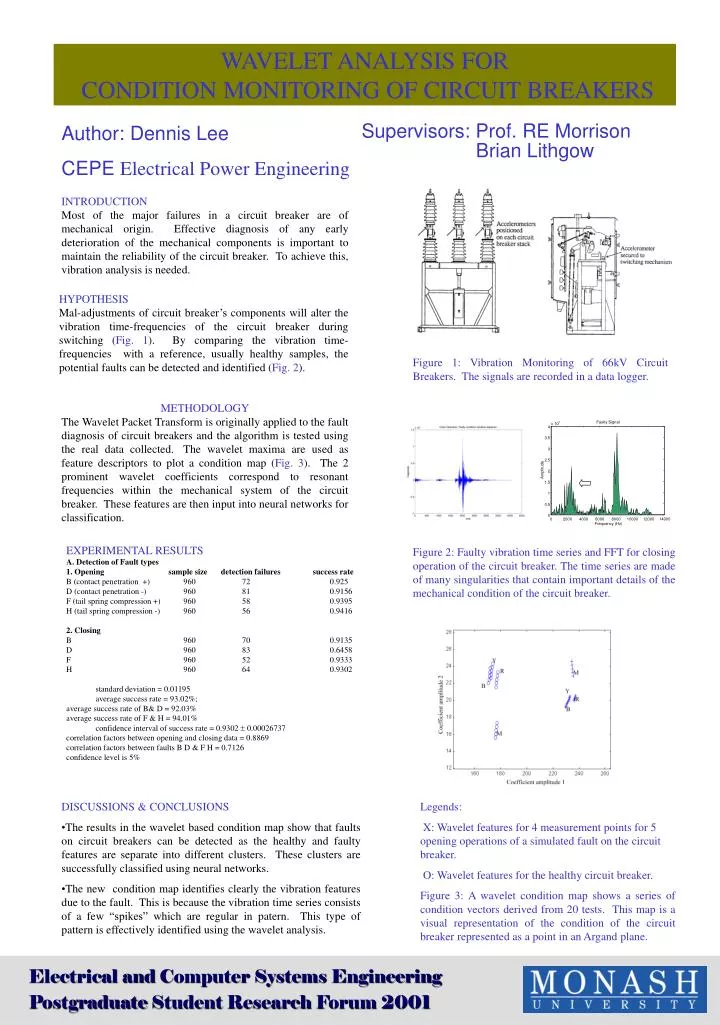
WAVELET ANALYSIS FOR CONDITION MONITORING OF CIRCUIT BREAKERS Supervisors: Prof. RE Morrison Brian Lithgow Author: Dennis Lee CEPE Electrical Power Engineering • INTRODUCTION • Most of the major failures in a circuit breaker are of mechanical origin. Effective diagnosis of any early deterioration of the mechanical components is important to maintain the reliability of the circuit breaker. To achieve this, vibration analysis is needed. HYPOTHESIS Mal-adjustments of circuit breaker’s components will alter the vibration time-frequencies of the circuit breaker during switching (Fig. 1). By comparing the vibration time-frequencies with a reference, usually healthy samples, the potential faults can be detected and identified (Fig. 2). Figure 1: Vibration Monitoring of 66kV Circuit Breakers. The signals are recorded in a data logger. METHODOLOGYThe Wavelet Packet Transform is originally applied to the fault diagnosis of circuit breakers and the algorithm is tested using the real data collected.The wavelet maxima are used as feature descriptors to plot a condition map (Fig. 3). The 2 prominent wavelet coefficients correspond to resonant frequencies within the mechanical system of the circuit breaker. These features are then input into neural networks for classification. Figure 2: Faulty vibration time series and FFT for closing operation of the circuit breaker. The time series are made of many singularities that contain important details of the mechanical condition of the circuit breaker. EXPERIMENTAL RESULTS A. Detection of Fault types 1. Opening sample size detection failures success rate B (contact penetration +) 960 72 0.925 D (contact penetration -) 960 81 0.9156 F (tail spring compression +) 960 58 0.9395 H (tail spring compression -) 960 56 0.9416 2. Closing B 960 70 0.9135 D 960 83 0.6458 F 960 52 0.9333 H 960 64 0.9302 standard deviation = 0.01195 average success rate = 93.02%; average success rate of B& D = 92.03% average success rate of F & H = 94.01% confidence interval of success rate = 0.9302 0.00026737 correlation factors between opening and closing data = 0.8869 correlation factors between faults B D & F H = 0.7126 confidence level is 5% • DISCUSSIONS & CONCLUSIONS • The results in the wavelet based condition map show that faults on circuit breakers can be detected as the healthy and faulty features are separate into different clusters. These clusters are successfully classified using neural networks. • The new condition map identifies clearly the vibration features due to the fault. This is because the vibration time series consists of a few “spikes” which are regular in patern. This type of pattern is effectively identified using the wavelet analysis. Legends: X: Wavelet features for 4 measurement points for 5 opening operations of a simulated fault on the circuit breaker. O: Wavelet features for the healthy circuit breaker. Figure 3: A wavelet condition map shows a series of condition vectors derived from 20 tests. This map is a visual representation of the condition of the circuit breaker represented as a point in an Argand plane. Electrical and Computer Systems Engineering Postgraduate Student Research Forum 2001