Download
1 / 1
20 likes | 183 Views
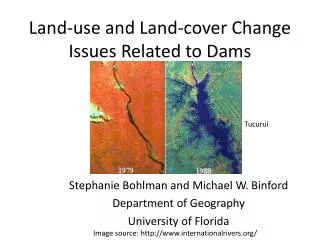
The Cuiabá-Santarém Road Linkage and Land Cover Change: Assessing Differences in Deforested Area from Different Remotely Sensed Data Sources HAYASHI, Corey Hetrick, Scott S. ( chayashi@indiana.edu ) ( shetrick@indiana.edu ). MODIS –LAND COVER PRODUCT

E N D
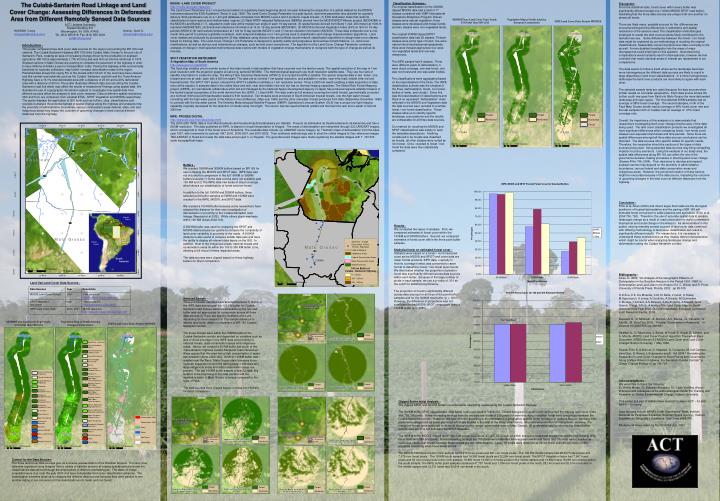
The Cuiabá-Santarém Road Linkage and Land Cover Change: Assessing Differences in Deforested Area from Different Remotely Sensed Data Sources HAYASHI, Corey Hetrick, Scott S. (chayashi@indiana.edu) (shetrick@indiana.edu) MODIS –LAND COVER PRODUCT http://modis-land.gsfc.nasa.gov/ The Land Cover Parameter is a 1-km product provided on a quarterly basis beginning about one year following the acquisition of a global dataset by the MODIS instrument aboard the EOS-A platform (Terra) in July, 1999. The Land-Cover Change Parameter is a post-launch, near-term parameter also planned for quarterly delivery. Both parameters rely on a 1-km grid database composite from MODIS Level 2 and 3 products. Inputs include: (1) EOS land/water mask that restricts classification to land regions and shallow water regions; (2) Nadir BRDF-adjusted Reflectances (NBARs) derived from the MODIS BRDF/Albedo product (MOD43B4) in the MODIS Land Bands (1-7), adjusted to nadir view at the median sun angle of each 16-day period; (3) spatial texture derived from Band 1 (red, 250-meter) at 1000-m resolution MODAGTEX); (4) directional reflectance information at 1k for 16-day periods (MOD43B1); (5) MODIS Enhanced Vegetation Index (EVI) at 1km for 16-day periods (MOD13);(6) land surface temperature at 1 km for 8-day periods (MOD11); and (7) terrain elevation information (MOD03). These data composite over a one-month time period to produce a globally-consistent, multi-temporal database on a 1-km grid as input to classification and change characterization algorithms. Land cover classes are produced by processing the 32-day database using decision tree and artificial neural network classification algorithms to assign land cover classes based on training data. The Land-Cover Change 1-km Parameter is designed to quantify subtle and progressive land-surface transformations, i.e., land cover modifications, as well as obvious and instantaneous changes, such as land cover conversions. The algorithm for the Land-Cover Change Parameter combines analyses of change in multi-spectral-multi-temporal data vectors with models of vegetation change mechanisms to recognize both the type of change as well as its intensity. SPOT VEGETATION INSTRUMENT A Vegetation Map of South America http://www.gvm.jrc.it/glc2000/ The Spot map enables one to monitor some of the major trends in deforestation that have occurred over the last ten years. The spatial resolution of the map is 1 km pixel resolution with the projection graphic at Lat/Long, spheroid WGS84. The methodological approach use multi-resolution satellite data. They use four sets of satellite information to create the map. The Along Track Scanning Radiometer (ATSR-2) is on board the ERS-2 satellite. The sensor acquires data in two ‘looks’, one forward and one at nadir, each with a 500 km swath. The data are at nominal 1 km spatial resolution, and available in visible, near-infra read, middle infra-red and thermal bands. The SPOT VGT sensor onboard the SPOT 4 satellite is similarly a 1 km resolution sensor. It has a 2000 km swath enabling a daily acquisition of data even at the equator. It samples data in the visible (blue and red), near and middle infra-red, but has no thermal imaging capacities. The Global Rain Forest Mapping project (GRFM), an international collaborative effort led and managed by the National Space Development Agency of Japan has produced regional satellite mosaics of the humid tropical ecosystems of the world derived from the JERS- 1 L band SAR. The data come as full mosaics covering the humid forests, geometrically corrected at a nominal 100m pixel with backscatter scaled to 8 bit resolution. Two mosaics were produced of South American tropical forests, one the high water mosaic, coinciding with the high water period of the Amazon river at Manaus, (May-July 1996) and the other low watermosaic produced from data (September-December 1995) to coincide with the low water period. The Defense Meteorological Satellite Program (DMSP) Operational Linescan System (OLS) has a unique low light imaging capability originally developed for the detection of clouds using moonlight. The sensor has two spectral bands (visible and thermal infra-red) and a swath of around 3000 km. INPE- PRODES DIGITAL http://www.obt.inpe.br/prodes/index.html The 2000-2001 INPE data is from Monitoramento da Floresta Amazônica Brasileira por Satélite: Projecto de Estimativa de Desflorestamento da Amazônia and has a 28.5M resolution. The data published by INPE, is based on visual interpretation of images. The areas of deforestation are interpreted through 223 LANDSAT images, which corresponds to most of the forest area of Amazônia. The available data include: (a) LANDSAT scene imagery (b) Thematic maps of deforestation from the base year 1997, with increments for periods 1997-2000, 2000-2001 and 2001-2002. Their synthesis methodology was to elect the orbital images b) Geo-reference images TM/LANDSAT c) Read and create the data base and project 3. e) Register- The georeferenced images were made registering the satellite images with 1: 100.000 scale topographical maps. Classification Schemes - The original classification for the 300KM clipped MODIS data had a total of 17 classes consistent with IGBP International Geosphere-Biosphere Program. Eleven classes were natural vegetation, three classes were developed and mosaic lands and two classes were non-vegetated lands. The original 300KM clipped SPOT classification data had 26 classes. Thirteen classes were some type of forest, five were natural shrub land/savannah/grasslands, three were mosaics/agriculture four were non-vegetated lands and one was mangroves. The INPE sample had 9 classes. Three were different years of deforestation, 3 were cloud coverage, one was forest, one was non-forest and one was water bodies. The classifications were aggregated based on the least detailed of the three. The INPE classification scheme was the simplest of the three (deforestation, forest, non-forest, bodies of water, and clouds). Since this was the least detailed of classifications and there is no equivalent “deforestation” class reflected in the MODIS and Vegetation data the data sources were recoded to a simple forest / non-forest classification. These classes allow us to identify specific landscape cover patterns and the results are comparable for all three data sources. Our method for recoding the MODIS and SPOT classifications was simply to read the metadata descriptions. Anything considered to be forests was classified as forests, all other classes were coded as non-forest. Once recoded to forest / non-forest the data were then statistically compared. Discussion- From the statistical tests, forest cover within every buffer was significantly different except one (100km MODIS SPOT road buffer), illustrating that the three data sources are unique from one another on almost all levels. There are likely many possible sources for the differences we encountered beyond the differences in radiometric and spatial resolutions of the sensors used. The classification methodologies employed to create the land cover products likely contributed to the deviation we see. Some differences between the forest / non-forest data might be explained by our methodology of recoding the original classifications. Seasonality concerning land cover data could play a role as well. A more detailed investigation into the areas of major discrepancies could shed light on this question. Georeferencing complications would certainly result in discrepancies, however we feel confident that nearly identical areas of interest are represented in our comparisons. The data seems to follow a trend where as the landscape becomes more heterogeneous the different data sources are likely to result in large disparities in land cover classifications. In a more homogeneous landscape the land cover products are more likely to agree with each other. The selected sample tests are useful because the data sources show similar results on a broader perspective. Each data source shows the further south one goes from Pará into Mato Grosso the more deforested landscape and open space. The first selected 50KM samples had an average of 98% forest coverage. The second samples, north of the Pará Mato Grosso border had an average of 66% forest cover rate and the last samples north of Cuiabá, had an average of 37% forest coverage rate. Overall, the importance of this analysis is to demonstrate that researchers investigating land cover change must be wary of the data being used. The land cover classification products we investigated all have significant differences when comparing forest / non-forest cover classes over equivalent land areas and time periods. Since there are spatial differences amongst all three data sources conclusions can be distorted. The data sources offer specific details for specific needs. Therefore, the researcher should be cautious of the types of data sources being used. Using assorted data sources may bring compelling impacts for policy scenarios. Using the example of our study area, the spatial data differences along BR 163 can affect the role of the governance decision-making processes in directing land cover change (Soares-Filho 746: 2004). Their decisions to develop and expand soybean sectors may depend on the proximity of administrative boundaries, various federal and state conservation areas and indigenous areas. However, the perceived location of these sectors might be inaccurate because of the data source, impacting the outcome of upcoming changes in the land cover at different distances from the highway. Conclusion - Filho et al, Alves (2002) and others argue that roads are the strongest predictors of tropical deforestation and the paving of BR-163 will stimulate forest conversion to cattle pastures and agriculture (Filho et al. 2004:756, 762). Therefore, the use of accurate spatial data to analyze landscape change as a result of road construction is vital to understand biophysical and social change in the Amazon. As demonstrated in this poster, varying remotely sensed sources of land cover data combined with differing methodology of land cover classification can result in significantly different results. For researchers, it is necessary to understand these contradictions as they display distinct characteristics which might be crucial when analyzing landscape change and deforestation along the Cuiabá-Santarém corridor. Bibliography - Alves. D. 2002. “An Analysis of the Geographic Patterns of Deforestation in the Brazilian Amazon in the Period 1991-1996” In Deforestation and Land Use In the Amazon Ed. C. Wood, and R. Porro University of Florida Press. Florida, 2002. pp 95-105. H.D.Eva, E.E. De Miranda, C.M. Di Bella, V.Gond, O.Huber, M.Sgrenzaroli, S.Jones, A.Coutinho, A.Dorado, M.Guimarães, C.Elvidge, F.Achard, A.S.Belward, E.Bartholomé, A.Baraldi, G.De Grandi, P.Vogt, S.Fritz, A.Hartley.The Land Cover Map for South America in the Year2000.GLC2000 database, European Commision Joint Research Centre, 2003. Nepstad, D., D. McGrath., A. Alencar., A.C. Barros., G. Carvalho, G. Santilli., M. Vera Diaz 2002. “Frontier Governance in Amazonia” In Science Vol 295(5555) pp 929-631 Strahler, A., D. Muchoney, J. Borak, M Friedl, S. Gopal, E. Lambin, and A. Moody. MODIS Land Cover Product Algorithm Theoretical Basis Document (ATBD)Version 5.0 MODIS Land Cover and Land-Cover Change: Boston University, 1 May 1999. Soares-Filho B, A Alencar, D. Nepstad, G. Cerqueira, M. Del Carmen Vera Diaz, S. Rivero, L Solorazano and E. Voll 2004 “ Simulating the Response of Land-Cover Changes to Road Paving and Governance Along a Major Amazon Highway: the Santarém-Cuiabá Corridor” in Global Change Biology 10 pp 745-764 Acknowledgments - We would like to thank the following: Dr. Emilio Moran, Dr. Eduardo Brondizio, Dr. Leah VanWey, Alvaro D’Antona and colleagues at the Anthropological Center For Training and Research on Global Environmental Change, Indiana University. This poster is a part of collaborative research between ACT – IU and NEPO – Unicamp. Data Sources include NASA's Earth Observatory Team, Instituto Nacional de Pesquisas Espaciais (Brazilian Space Agency), Instituto Brasileiro de Geografia e Estatistica, GeoCover and ESRI. Background image taken by Scott Hetrick July, 2003. ACT / Indiana University Student Building 331 Bloomington, IN. USA, 47405. Tel. (812) 855-816; Fax (812) 855-3000 act@indiana.edu) Introduction - This poster compares three land cover data sources for the region surrounding the BR 163 road network. The Cuiabá Santarém Highway (BR 163) links Cuiabá, Mato Grosso to the port city of Santarém, Pará, creating an area of increasing change driven by the production of soybean agriculture. BR 163 is approximately 1,700 km long and was first cut into the rainforest in 1974. Soybean sectors in Mato Grosso are pushing to complete the pavement of the highway in order to save millions of dollars a year in transportation costs. Paving this highway, while economically beneficial for soybean cultivators, may further increase deforestation rates in the region. Published data shows that nearly 5% of the forests within 50 km of the road have been cleared, and that central road networks such as the Cuiabá- Santarém road link and the Trans Amazon Highway have a 16.1% total deforested area with a distance of 25 km and a 24% deforested area with a distance of 50 km. The poster illustrates different data sources along the Cuiabá-Santarem road link which may affect the results of researchers’ findings using spatial data. We illustrate the use of a geographic information system to investigate how spatial data from different sources affect the analysis of land cover research. Data at different spatial resolutions, 30m and 1km, are compared, from Landsat ETM+, SPOT Vegetation and MODIS respectively. The poster displays the application of GIS tools such as buffers, clips, classifications and recodes to analyze the potential spread of spatial change along the highway and analyzes how the proximity of administrative boundaries, various conservation areas (federal, state, etc) and indigenous areas may impact the outcome of upcoming changes in land cover at different distances from the highway. Buffers - We created 100KM and 300KM buffers based on BR 163 for use in clipping the MODIS and SPOT data. INPE data was not included for comparison in the full 100KM or 300KM buffers because 1) Some data scenes were not available past 100 KM and 2) The INPE data had areas of cloud coverage which skews our classification of forest and non-forest. In addition to the full 100KM and 300KM buffers, three selected point buffer samples at 50KM and 100KM were created for the INPE, MODIS, and SPOT data We created a 100 KM buffer because some researchers have adopted this distance for their own investigation of deforestation in proximity to the Cuiabá-Santarém road linkage (Nepstad et al 2002). While others place emphasis within 100 KM (Alves 2002:103). A 300 KM buffer was used for analyzing the SPOT and MODIS data because our goal is to compare the complexity of land cover variability in proximity to the roads. A 300KM distance is also useful to compare similar data sets and have the ability to display all relevant data layers on the GIS. In addition, most of the indigenous areas, national forests and conservation areas lie within the 100 to 300 KM buffer zone, allowing a full visual of these impacted areas. The data sources were clipped based on these highway buffers for direct comparison. Selected Sample - Three point buffer samples were selected because 1) Some of the INPE data scenes past the 100 KM buffer for Cuiabá-Santarém road linkage were not accessible so the full road buffer was not appropriate for comparison across all three data sources 2) There are specific locations which are interesting for more research 3) The sample allows us to identify land cover detail in comparison to BR-163 Cuiabá-Santarém corridor. The areas chosen were within the 100KM buffer of the Cuiabá-Santarém corridor and depended on variables such as lack of cloud coverage in the INPE data and proximity to national forests, state conservation areas and indigenous areas. Hence, we created a 50 KM buffer just south of the Trans-Amazon highway Cuiabá-Santarém road intersection. Alves argues that this area has a high concentration of major deforestation (Alves 2002:102). Another 100KM buffer was created near the Pará / Mato Grosso state boundary since soybean expansion is currently taking place in this area and large indigenous areas and state conservation areas are present. The last 100KM buffer sample is near Cuiabá, this location is the beginning of the road corridor and the vegetative cover in Mato Grosso is unique compared to the state of Pará. The data sources were clipped based on these point buffers for direct comparison. Results - We conducted two types of analysis. First, we compared estimates of forest cover within the 100KM and 300KM buffers. Second, we compared estimates of forest cover within the three point buffer samples. Statistical tests on estimated forest cover - Statistics were based on a forest / non-forest pixel count as the MODIS and SPOT land cover data are raster format products. INPE data, originally in ArcInfo coverage format, was converted to raster format to determine forest / non-forest pixel counts. We then tested whether the proportion of pixels in forest was significantly different across data sources within each buffer. Because of the large number of pixels in each sample, we use a p-value of .001 as the cutoff for statistical significance. The proportion of forest is significantly different across data sources for all three of the point buffer samples and for the 300KM road buffer (p < .0001). However, the difference in proportions was not significant for the MODIS-SPOT comparison using a 100KM buffer (p = .1080). Land Use Land Cover Data Sources - Clipped Buffer Initial Analysis - The clipped SPOT and MODIS buffers revealed some interesting results along the Cuiabá Santarém Highway. The 300KM buffer SPOT clipped raster data had a total pixel count of 1,269,132. Closed evergreen tropical forest represented the majority land cover class with 798,798 pixels. Some interesting findings from the analysis are a total of 339 pixels for semi-deciduous transition forest were categorized between the Cuiabá Santarém corridor. However, this type of forest according to the metadata is a geographicspecific forest formation of northern Bolivia. Similarly, 160 pixels were categorized as forest plantation which are located in the east of the Venezuelan llanos. 66 pixels were counted for mangroves. However, the mangrove forests were scattered north-south throughout the image, some in the state of Mato Grosso. 39 pixels were also counted for the classification outside area which is not defined in the SPOT metadata. The 300KM buffer MODIS clipped raster data had a total pixel count of 1,407,551 pixels, of which evergreen broad leaf forests represented the majority land cover class with 984,609 pixels. Some interesting findings are 708 pixels were classified as evergreen needle leaf forest and 14 pixels were classified as deciduous needle leaf forests however these forests are not in the Amazon. Lastly, 40 pixels were classified as mixed forest even though there is little metadata describing what mixed forest entails. The MODIS 50KM point buffer north sample had 8,675 forest pixels and 287 non-forest pixels. The 100 KM middle sample had 28,457 forest pixels and 7,679 non-forest pixels. The 100KM south sample had 14,366 forest pixels and 22,294 non-forest pixels. The SPOT Vegetation Index had 7,947 forest pixels and 93 non-forest pixels in the north sample; 19,850 forest 12,595 non-forest pixels in the middle sample and 14,662 forest 18,258 non-forest pixels in the south sample. The INPE buffer point samples contained 47,787 forest and 1,184 non-forest pixels in the north; 28,140 forest and 20,514 non-forest in the middle sample and 13,311 forest and 34,614 non-forest in the south. Control for the Data Sources- The three land cover data sources give us a diverse representation of the Brazilian Amazon. The land cover data was organized using imagery from a variety of satellite sensors at varying spatial resolutions and the classifications determined through the employment of different methodologies. The dates of image acquisition were in or near the year 2000 and have comparable land cover classification schemes. The classification schemes allow us to compare the different data sources because they were parallel to one another aiding in our conversion of the classifications into forest and non-forest.