Download
1 / 3
30 likes | 37 Views
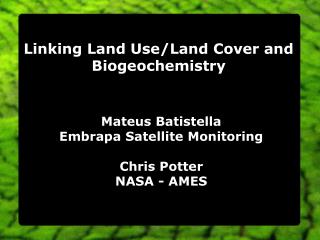
Land use and land cover is very important for appropriate planning and budget of a community. In Jibia several activities are carried on the land without actually knowing the percentage of the land cover of features. Remote sensing and GIS technology are valuable tools in managing land use and land cover. This research described the land use and land cover coverage of the entire LGA land using Remote Sensing and GIS. Landsat Satellite imagery of 2009 of the study area was processed and classified into 5 groups namely Build up sharp sand, Farm Land trees, Vegetation shrubs, Water body and Barren land. Statistical analysis was employed to show the percentage distribution of the land. The study shows the percentage coverage of land physical feature which in turn describe the land use. The research revealed that agriculture is the major activity in the study area. It also concluded by recommending the need for adequate measures to avoid desert encroachment and government support to enhance agricultural produce. Lugga M. S | Babale Z. T | Yamel A. G "Land use Land Cover Highlight for Jibia Local Government, Nigeria" Published in International Journal of Trend in Scientific Research and Development (ijtsrd), ISSN: 2456-6470, Volume-4 | Issue-4 , June 2020, URL: https://www.ijtsrd.com/papers/ijtsrd31134.pdf Paper Url :https://www.ijtsrd.com/other-scientific-research-area/other/31134/land-use-land-cover-highlight-for-jibia-local-government-nigeria/lugga-m-s<br>

E N D
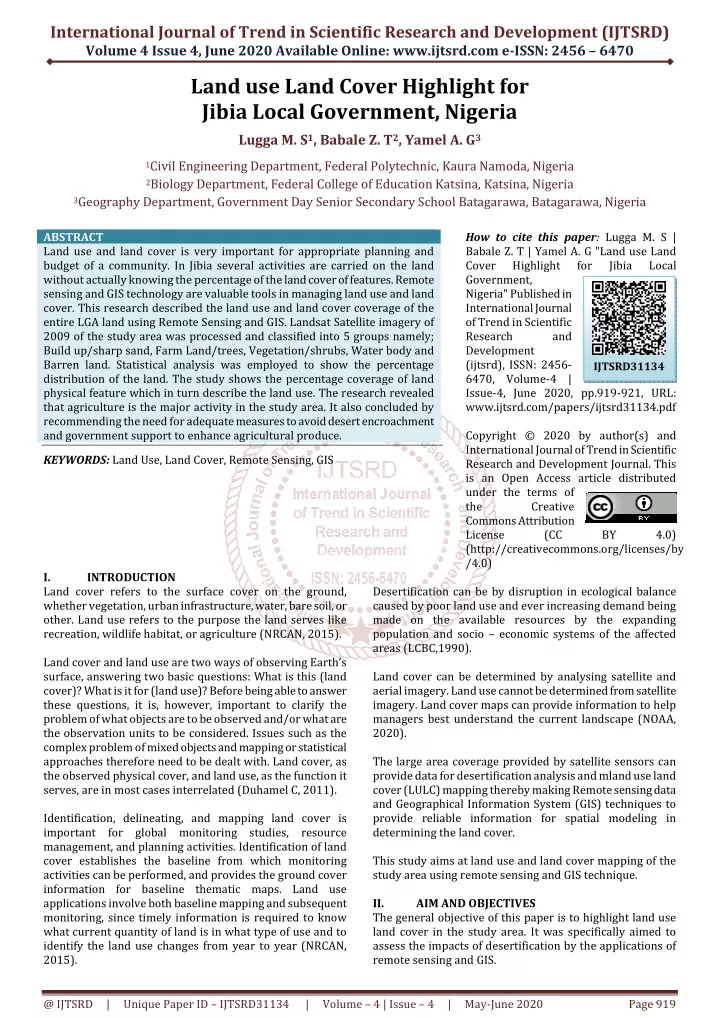
International Journal of Trend in Scientific Research and Development (IJTSRD) Volume 4 Issue 4, June 2020 Available Online: www.ijtsrd.com e-ISSN: 2456 – 6470 Land use Land Cover Highlight for Jibia Local Government, Nigeria Lugga M. S1, Babale Z. T2, Yamel A. G3 1Civil Engineering Department, Federal Polytechnic, Kaura Namoda, Nigeria 2Biology Department, Federal College of Education Katsina, Katsina, Nigeria 3Geography Department, Government Day Senior Secondary School Batagarawa, Batagarawa, Nigeria ABSTRACT Land use and land cover is very important for appropriate planning and budget of a community. In Jibia several activities are carried on the land without actually knowing the percentage of the land cover of features. Remote sensing and GIS technology are valuable tools in managing land use and land cover. This research described the land use and land cover coverage of the entire LGA land using Remote Sensing and GIS. Landsat Satellite imagery of 2009 of the study area was processed and classified into 5 groups namely; Build up/sharp sand, Farm Land/trees, Vegetation/shrubs, Water body and Barren land. Statistical analysis was employed to show the percentage distribution of the land. The study shows the percentage coverage of land physical feature which in turn describe the land use. The research revealed that agriculture is the major activity in the study area. It also concluded by recommending the need for adequate measures to avoid desert encroachment and government support to enhance agricultural produce. KEYWORDS: Land Use, Land Cover, Remote Sensing, GIS How to cite this paper: Lugga M. S | Babale Z. T | Yamel A. G "Land use Land Cover Highlight Government, Nigeria" Published in International Journal of Trend in Scientific Research and Development (ijtsrd), ISSN: 2456- 6470, Volume-4 | Issue-4, June 2020, pp.919-921, URL: www.ijtsrd.com/papers/ijtsrd31134.pdf Copyright © 2020 by author(s) and International Journal of Trend in Scientific Research and Development Journal. This is an Open Access article distributed under the terms of the Creative Commons Attribution License (CC (http://creativecommons.org/licenses/by /4.0) for Jibia Local IJTSRD31134 BY 4.0) I. Land cover refers to the surface cover on the ground, whether vegetation, urban infrastructure, water, bare soil, or other. Land use refers to the purpose the land serves like recreation, wildlife habitat, or agriculture (NRCAN, 2015). Land cover and land use are two ways of observing Earth’s surface, answering two basic questions: What is this (land cover)? What is it for (land use)? Before being able to answer these questions, it is, however, important to clarify the problem of what objects are to be observed and/or what are the observation units to be considered. Issues such as the complex problem of mixed objects and mapping or statistical approaches therefore need to be dealt with. Land cover, as the observed physical cover, and land use, as the function it serves, are in most cases interrelated (Duhamel C, 2011). Identification, delineating, and mapping land cover is important for global monitoring studies, resource management, and planning activities. Identification of land cover establishes the baseline from which monitoring activities can be performed, and provides the ground cover information for baseline thematic maps. Land use applications involve both baseline mapping and subsequent monitoring, since timely information is required to know what current quantity of land is in what type of use and to identify the land use changes from year to year (NRCAN, 2015). INTRODUCTION Desertification can be by disruption in ecological balance caused by poor land use and ever increasing demand being made on the available resources by the expanding population and socio – economic systems of the affected areas (LCBC,1990). Land cover can be determined by analysing satellite and aerial imagery. Land use cannot be determined from satellite imagery. Land cover maps can provide information to help managers best understand the current landscape (NOAA, 2020). The large area coverage provided by satellite sensors can provide data for desertification analysis and mland use land cover (LULC) mapping thereby making Remote sensing data and Geographical Information System (GIS) techniques to provide reliable information for spatial modeling in determining the land cover. This study aims at land use and land cover mapping of the study area using remote sensing and GIS technique. II. AIM AND OBJECTIVES The general objective of this paper is to highlight land use land cover in the study area. It was specifically aimed to assess the impacts of desertification by the applications of remote sensing and GIS. @ IJTSRD | Unique Paper ID – IJTSRD31134 | Volume – 4 | Issue – 4 | May-June 2020 Page 919
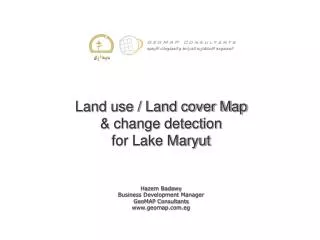
International Journal of Trend in Scientific Research and Development (IJTSRD) @ www.ijtsrd.com eISSN: 2456-6470 ?To perform image classification of ? To perform statistical analysis of the classified image III. STUDY AREA Jibia LGA is a Local Government located in Katsina State in the northern part of Nigeria. Jibia sits along on the Nigerian border with Niger, it shares borders with Batsari, Kaita, Katsina and Batagarawa LGA of Katsina State and Zurmi LGA of Zamafara State. The population of the LGA was approximately 169,748 as of 2006 and the area is 1037 Km2. The LGA is located within geographical coordinates 130 05’ 30’’ N and 70 13’ 35’’. the study area Figure 1: Map of the study area IV. 1.Materials Used: The materials used are software, hardware and datasets. The hardware used are : A.Laptop computer Software used A.Erdas Imagine 9.1 B.ArcGIS v10.1 Desktop C.Microsoft Excel. D.Microsoft word The dataset used are: A.Landsat satellite Image of 2009 B.Topographic map of Jibia LGA METHODOLOGY 2.Methodology: The procedural steps used in the analysis of the datasets in this study are summarized in figure Figure 2: A flow diagram of the steps used in carrying out the research. Administrative Map of Jibia LGA Landsat satellite Image Image Processing Base Map (Image Subset) Ground Truth Image Classification Statistical Analysis Results and Discussion ?Satellite Image/image processing: Landsat satellite imagery was obtained for the year 2009. A digital image rectification and restoration was done to correct the distorted image, the digital image was geometrically corrected using geo- referencing so-called ground control point with known co-ordinates to the corresponding pixels in the image. And also image enhancement on the scene (2009) was performed. ?Images classification:This was done to categorize all pixels in an image into land cover classes or themes. This is either supervised or unsupervised classification. This study used unsupervised classification. Five classes namely barren land, water body, vegetation/trees, farm land/shrubs and build up/sharp sand were selected. @ IJTSRD | Unique Paper ID – IJTSRD31134 | Volume – 4 | Issue – 4 | May-June 2020 Page 920
International Journal of Trend in Scientific Research and Development (IJTSRD) @ www.ijtsrd.com eISSN: 2456-6470 V. RESULTS AND DISCUSSION Table1: Area and percentage occupied by each class. Classes Area(Ha) Build up/sharp sand 8091.100 Farm Land/trees 32456.07 Vegetation/shrubs 30943.76 Water body 2582.23 Barren land 33152.05 107225.21 From Table 1, figure 5, barren land occupies the largest land area with 33152.05ha farmland/shrubs with 32456.07ha (30.269%) and then vegetation/trees with 30943.76ha (28.859%). Water body covers the least area with 2582.23ha (2.408%) and then build up/sharp sand areas with 8091.1 ha (7.546%). VI. CONCLUSION In this paper GIS based analysis of remote sensed data was employed show the land use land cover of Jibia LGA. The analysis shows that most of the occupants in the study area depends on agriculture. It shows the presence of a Dam used for irrigation and other agricultural purposes. 30% are farm lands/trees which is almost four times the builup/sharp sand. Shrubs for grazing and the percentage of barren land may lead to desertification if not tackled on time. VII. RECOMMENDATION 1.Adequate measures should be taken to avoid desert encroachment. 2.Agricultural support should be given to farmers to improve their production 3.A temporal GIS analysis should be done do detect LULC changes in the study area REFERENCES [1] Duhamel, C. (2011). Land Use And Land Cover, Including Their Classification. Retrieved from: http://www.eolss.net. Downloaded on: 20th May, 2020. Percentage 7.546 30.269 28.859 2.408 30.918 100.000 (30.918%), followed by Figure 3: Landsat image of 2009 Figure 4: Classified image of 2009 [2] LCBC, (1990). The Lake Chad Conventional Basin. A Diagnostic study of Environmental Degredation. [3] NOAA, (2020). What is the difference between land cover and land use. http://www.oceanservice.noaa.gov/facts/lclu.html. Downloaded on: 20th May, 2020. Retrieved from: [4] NRCAN, (2015). Land cover and Land Use. Retrieved from: http://www.nrcan.gc.ca/maps-tools-and- publications.html. Downloaded on: 20th May, 2020 Figure 5: Pie chart of 2009 classified image @ IJTSRD | Unique Paper ID – IJTSRD31134 | Volume – 4 | Issue – 4 | May-June 2020 Page 921