Download
1 / 18
180 likes | 371 Views
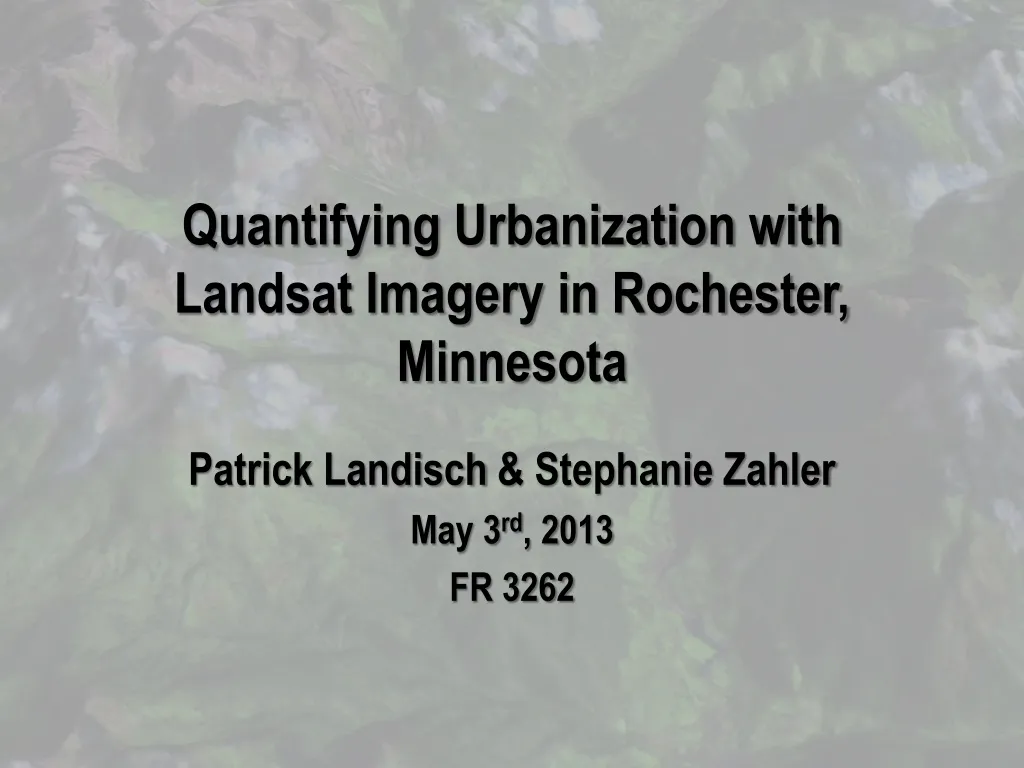
Quantifying Urbanization with Landsat Imagery in Rochester, Minnesota. Patrick Landisch & Stephanie Zahler May 3 rd , 2013 FR 3262. Rochester, Minnesota. Third largest city in Minnesota Population: 57,890 in 1980* 70,745 in 2000* 209,607 in 2012. *U.S. Decennial Census.

E N D
Quantifying Urbanization with Landsat Imagery in Rochester, Minnesota Patrick Landisch & Stephanie Zahler May 3rd, 2013 FR 3262
Rochester, Minnesota • Third largest city in Minnesota • Population: • 57,890 in 1980* • 70,745 in 2000* • 209,607 in 2012 *U.S. Decennial Census
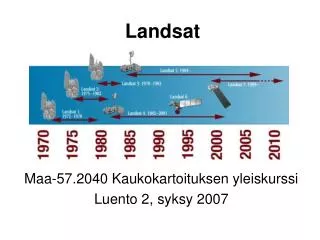
Original Landsat 5 Imagery May, 1985 April, 2001
Image Preparatory Process • Nad 83 UTM Zone 15N • Determine area of interest in Arc GIS • Minnesota Data Deli PLS Townships • Export shapefile of area of interest • Clip image to area of interest • 4 townships containing Rochester in Olmsted County • Range 13W, Township 107N • Range 13W, Township 106N • Range 14W, Township 107N • Range 14W, Township 106N
Clipped Imagery May, 1985 April, 2001
Classification • Supervised classification • 10-20 training sites for each class • Classified: • Urban Areas • Agriculture • Forest Land • Water • Bare Soil
Classified Images May, 1985 April, 2001
Change Detection Thematic Change Image Difference 20% threshold on “highlight change” image Pixel by pixel method • Uses the classified images • Detects change within five “Zones” • Zones determined by classified image
Accuracy Assessment • Used NAIP imagery for the entire state of Minnesota • 2006 land cover data as reference for 2001 imagery • Clipped to our area of interest
Accuracy Assessment 71.43%
Discussion • 2001 as an endpoint for our study, but may be used as a starting point for future studies • Add another photo or two to monitor increment change between ’85 and ‘01 • Rough study of 15 years of urban growth • It would be interesting to start this study during the 30’s or 40’s • Added two more photos from the fall • Improve classification process
Limitations/Challenges • First time using ERDAS to do data analysis • Did not find images with no cloud cover • 10% proved to be acceptable • No reference map used for 1985 classification • Provided more confidence in our results • Could not find images from the same month • Interpreting the data with confidence
Conclusion • Learning experience with ERDAS Imagine • Urban expansion is important to monitor • Rapid • Useful in city planning and allocating resources • Historical information regarding previous land use • Provide a helpful resource for anyone attempting to do a similar project
References • http://deli.dnr.state.mn.us/ • http://landsat.gsfc.nasa.gov/about/landsat5.html • http://glovis.usgs.gov/ • http://www.fsa.usda.gov/FSA/NAIP • FR 3262 Lab Lesson 6- Image Operations and Clip • FR 3262 Lab Lesson 11- Supervised Classification • FR 3262 Lab Lesson 12- Change Detection • FR 3262 Lab Lesson 11a- Accuracy Assessment