Download
1 / 26
320 likes | 587 Views
Operational Crop Monitoring Using Synthetic Aperture Radar (SAR). C PATNAIK Space Applications Centre. SAR SYSTEMS. Frequent cloud cover during monsoon and sometimes in winter is a hindrance for using data from optical remote sensing

E N D
Operational Crop Monitoring Using Synthetic Aperture Radar (SAR) C PATNAIK Space Applications Centre
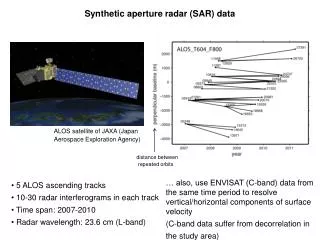
SAR SYSTEMS • Frequent cloud cover during monsoon and sometimes in winter is a hindrance for using data from optical remote sensing • SAR, due to its self illuminating beam, has all weather and day/night acquisition capability • Current space borne SAR systems are available in 3 frequencies: C, L and X • For agricultural crop monitoring C band SAR is found to be most suitable • A variety of beam modes are available from these sensors based on the look angles • Operational C band SAR systems currently available are Envisat ASAR and Radarsat • Envisat ASAR has low swath coverage with an image size of not more than 8500 km2 • Radarsat ScanSAR beam has coverage of 90000 km2 withPixel spacing of 25 m • For jute crop, due to small field sizes, Wide 2 beam is chosen. Image size is 22500 km2 and pixel spacing is 12.5 m • Multi temporal SAR data is acquired to monitor the crop growth and use it for classification
The backscatter response is a function of the crop roughness, moisture and geometry Different crops have different backscattering properties based on their canopy structure and moisture content In the case of rice crop, the background standing water has a significant contribution to the backscatter till the PI stage In the case of crops where there is no background standing water, the backscatter is influenced by row orientation, density, canopy & soil moisture and roughness CROP DISCRIMINATION USING SAR
FASAL - RICE (1999 ) (2007 ) Wet Season (Kharif) Total Coverage: 13 states accounting for >93 % rice production and >88 % acreage Winter Rice (Rabi) Total Coverage: 04 states accounting for >86 % rice production and >82 % acreage 36 Radarsat ScanSAR Narrow B frames acquired on three dates. (108 scenes) 15 Radarsat ScanSAR Narrow B frames acquired on three dates. (45 scenes)
PARTICIPATING AGENCIES • Scientists from the following centres / agencies participate in the project: • Space Applications Centre, Ahmedabad • National Remote Sensing Centre (NRSC), Hyderabad • Remote Sensing Applications Centre (RS AC-UP), Lucknow, Uttar Pradesh • State Remote Sensing Applications Centre, Bhopal, Madhya Pradesh • Institute of Environmental Studies and Wetland Management (IES&WM), Kolkata, West Bengal • Orissa Space Applications Centre (ORSAC), Bhubaneswar, Orissa • Bihar Remote Sensing Applications Centre (BIRSAC), Patna, Bihar • State Remote Sensing Applications Centre (JRSAC), Jharkhand • Assam Remote Sensing Applications Centre (ARSAC), Guwhati, Assam • AP State Remote Sensing Applications Centre (APSRAC), Hyderabad, Andhra Pradesh • Punjab Remote Sensing Centre (PRSC), Ludhiana, Punjab • Department of Agriculture, Chennai, Tamil Nadu • Remote Sensing Applications Centre, Raipur, Chhattisgarh • Karnataka State Remote Sensing Applications Centre, Bangalore, Karnataka • Haryana Remote Sensing Applications Centre (HARSAC), Hissar, Haryana
DATA & EPHEMERIS DOWNLOAD SPECKLE SUPPRESSION SLANT – GROUND RANGE CONV. DATA TRUNCATION GEOREF HEADER GCPs MULTI LAYER IMAGE STACK ANALYSIS DATA ANALYSIS Transfer of sample segments Transfer of GT sites and Ancillary Information to image Signature Generation Automation Generation of Decision Rules & Classification Accuracy Checking Aggregation Validation and Forecast
OPTIMAL DATA SET Data is acquired based on the region’s crop calendar. Normally three dates are acquired; however, in some critical cases a fourth date is acquired. FIRST ACQ. SECOND ACQ. THIRD ACQ. E. Flowering Peak Veg. Puddling Transplanting Tillering 45 Days after transplanting. Accounts for more than 75% season’s rice FIRST FORECAST SECOND FORECAST 30 days before harvesting
MULTI TEMPORAL SAR DATA July 05, 2010 July 29, 2010 August 22, 2010 Normal Transplanted Rice Late Transplanted Rice Very late transplanted rice
RICE IN MULTI TEMPORAL SAR DATA Plantations Urban Water body Two date Composite Three date Composite (July 05, July 29, 2010) (July 05, 29 and Aug. 22, 2010) On two date composite, early transplanted rice would show as cyan and due to land preparation late transplanted rice would show red tones On three date composite, early rice is in blue tones and late transplanted rice is in magenta tones. Yellow tones are very late transplanted rice areas
CROP DISCRIMINATION WITH TEMPORAL SAR 6 5 4 3 2 1 2 3 4 5 6 7 Pre-transplantation Transplantation Tillering Vegetative Heading Maturity Peak-vegetative
CLASSIFICATION • Mask out the non-agriculture area • Within the agriculture area: • Delineate the crop phenology based on ground information • Take multiple areas where soil conditions are similar – this would help in correlating backscatter with canopy. • Conversely, with crop condition being similar, study the effect of soil conditions on backscatter • Generate crop profiles based on the backscatter to help in the discrimination • Generate a knowledge base • Create the decision rules (hierarchical) • Classify the image and do accuracy check
SAMPLE SEGMENT APPROACH District/Zone wise classification based on ground truth is done to accommodate different management practices. For each run, image under the segments of a zone is classified.
ACREAGE ESTIMATION • After classification and accuracy check: • Crop proportion per segment is calculated • Proportion is multiplied by N to get the crop area for the stratum • Correct for the pseudo stratum area based on the factor derived from geographical area to N segments area. • Aggregate the stratum wise figures to obtain state level area. • Project to National rice area
YIELD MODELING Yield for the season is modeled based on the following information. Daily weather data Station latitude Rain fall, Tmax, Tmin and solar radiation GDDs to reach emergence GDDs from emergence to flowering Historical yield database of the region for the past 15-20 years is considered. Production estimates are made and released along with acreage forecasts.
Part of W. Bengal Part of Orissa PROGRESS OF RICE TRANSPLANTATION 15th to 30th June; 1st to 8th July;9th to 16th July; 17th to 23rd July; 24 th to 31st July; 1st to 15th August.
0 2 4 6 8 10 Kg/m2 BIOMASS RETRIEVAL Radarsat Jul 23 Aug 16 Sep 09 Sep 09 3-Date FCC of the area Rice Biomass Map of the area
DAMAGE ASSESSMENT Super cyclone of Orissa, Oct 29, 1999 Crop at soft dough stage. Crop lodging and submergence were the main causes of damage. Assessment made by Nov.06. Flood AffectedRice Area Assessment
DAMAGE ASSESSMENT SAR Data FCC Classified Drought AffectedRice Area 2009: Jul 08, Aug 01, Aug 25 Yellow : Rice 2008: Jul 13, Aug 06, Aug 30 2009 Drought year 2008 Normal Year
MONITORING OF RICE CULTURAL TYPE WEST BENGAL SIKKIM BHUTAN ASSAM BANGLADESH BIHAR Legend Deep water rice Intermediate water rice Shallow water rice Permanent vegetation Urban ORISSA Water BAY OF BENGAL Multi-date FCC ScanSAR image Rice Cultural Types (Derived from remote sensing)
FASAL - JUTE • Area under jute: 7.71 lakh ha in 2008-09. • Assam, Bihar, West Bengal and Orissa are the major jute growing states in the country, which account for about 98 % of jute area. • The following table shows the state contribution to national jute area. Source:Agricultural Situation in India
ROAD MAP • About 85% of world’s jute cultivation is concentrated in Ganges delta. • Sown by mid April and harvested by mid July. No row spacing. • Crop identification was possible using 3 date SAR data. • Other vegetation class found was mostly homesteads, forest and occasional patches of vegetables (<1 ha). • Signature generation of various land cover was carried out. • Signature analysis showed that the crop signature in SAR stands apart from other land cover. • Since 2008, state and national level pre-harvest estimates were made.
METHODOLOGY • Radarsat Wide beam 2 data of three dates is used. • 11 frames x 3 dates = 33 scenes • GT using GPS comprises of land cover, crop and soil parameters. • Based on signatures of different features, decision rules are developed for jute crop discrimination. • Average accuracy around 92 %. Overall accuracy around 91 %. • Three major Jute growing states of Assam, Bihar and West Bengal are taken up. • State and national level pre-harvest estimates are made. • Final forecast of jute is given by mid July.
JUTE SIGNATURES FCC and classified image of 3-date Radarsat Wide 2 SAR data (May 3, May 27 and June 20, 2008) showing Jute growing areas (Yellow)
CONCLUSION • Lack of cloud free data during the rice season necessitated the development of methodology to adopt SAR data for crop monitoring • Operational crop acreage estimation currently being done for rice and jute crop using multi temporal SAR data • Acquisition plan has been taken care of depending on each state’s crop calendar • Stable signature banks have been developed for these crops • Databases are regularly updated for the program • Yield estimations done using in-season weather data • Three forecasts are given pre-harvest for rice and two preharvest forecasts for Jute • Our estimates match well with the DES figures released post harvest.