Download
1 / 25
260 likes | 447 Views
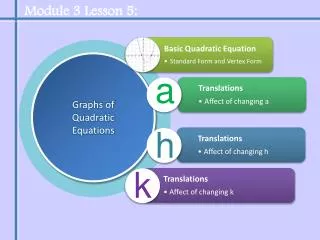
1.2 Graphs of Equations. Objective. Sketch graphs of equations Find x and y intercepts of graphs of equations Use symmetry to sketch graphs of equations Use graphs of equations in solving real-life problems. The graph of an equation.

E N D
Objective • Sketch graphs of equations • Find x and y intercepts of graphs of equations • Use symmetry to sketch graphs of equations • Use graphs of equations in solving real-life problems.
The graph of an equation • A relationship between two quantities can be expressed as an equation in two variables. • The graph of an equation is the set of all points that are solutions of the equation.
Determining Solutions • Determine whether (1, 3) and (-2, 4) are solutions of the equation
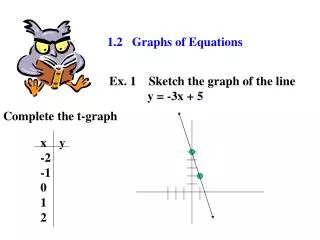
Sketching the graph of an equation • Example 2 Using the point-plotting method, sketch the graph of
If you have two few points with point-plotting technique you could badly mispresent the graph of an equation. • For example, using only the four points (-2, 2), (-1, 1), (1, -1) and (2, 2) any of these three graphs would be reasonable.
Intercepts of a Graph • Intercepts are points that have zero as either the x-coordinate or the y-coordinate. • It is possible for the graph to have one or several intercepts.
Finding intercepts • To find x-intercepts, let y be zero and solve the equation for x. • To find y-intercepts, let x be zero and solve the equation for y.
Symmetry • X-axis symmetry
Graphical Tests for Symmetry • 1. A graph is symmetric with respect to the x-axis if, whenever (x, y) is on the graph (x, -y) is also on the graph. • 2. A graph is symmetric with respect to the y-axis, if, whenever (x, y) is on the graph (-x, y) is also on the graph. • 3. A graph is symmetric with respect to the origin if, whenever (x, y) is on the graph (-x, -y) is also on the graph.
Algebraic Tests for Symmetry • 1. The graph of an equation is symmetric with respect to the x-axis if replacing y with –y yields an equivalent equation. • 2. The graph of an equation is symmetric with respect to the y-axis if replacing x with –x yields an equivalent equation. • 3. The graph of an equation is symmetric with respect to the origin if replacing x with –x and y with -y yields an equivalent equation.
Application • The net profits P (in millions of dollars) for a company from 2000 through 2005 can be approximated by the mathematical model P = 48.3t + 100.04 where t is the calendar year, with t = 0 corresponding to 2000
Construct a table of values that shows the net profits for each year.
Use the table of values to sketch a graph of the model. Then use the graph to estimate graphically the net profit for the year 2012.
Use the model to confirm algebraically the estimate you found in part (b)
How do you identify intercepts and symmetry in order to sketch graphs of equations? • Find intercepts by letting one variable be zero and solving for the other variable. • Identify symmetry by choosing a point (x, y) on the graph and checking to see whether the points (x, -y), (-x, y) or (-x, -y) are also on the graph.