Download
1 / 19
190 likes | 331 Views
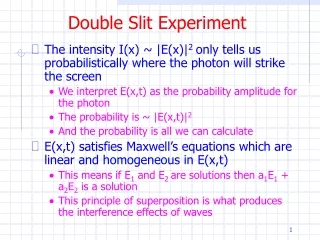
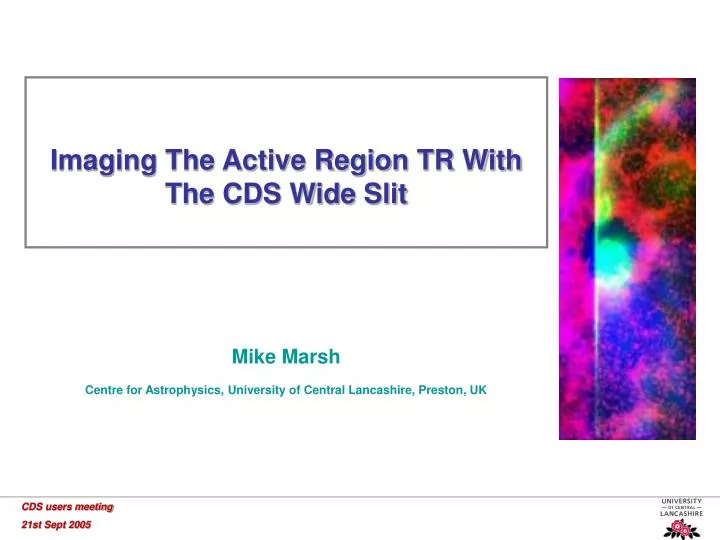
Imaging The Active Region TR With The CDS Wide Slit Mike Marsh Centre for Astrophysics, University of Central Lancashire, Preston, UK. The Wide Slit. Mg IX 368 Å. He I 584 Å. O V 629 Å. 90˝ × 240˝ FOV 26s cadence Produces intensity images (not rastered) in He I, O V & Mg IX

E N D
Imaging The Active Region TR With The CDS Wide SlitMike MarshCentre for Astrophysics, University of Central Lancashire, Preston, UK
The Wide Slit Mg IX 368 Å He I 584 Å O V 629 Å • 90˝× 240˝ FOV • 26s cadence • Produces intensity images (not rastered) in He I, O V & Mg IX • But no spectral data
Wide Slit Calibration Mg IX uncalibrated Mg IX calibrated
AR 10570 EIT 171 Å TRACE WL TRACE 1600 Å TRACE 171 Å
TRACE 1600 Å TRACE 1600 +171 Å TRACE 1600 +O V
Composite Movie TRACE 1600 Å O V TRACE 171 Å
Composite Movie O VTRACE 171 Å
Rastered data Rastered data gains line profile data, but loses time variability information
MDI WL + O V + 171 TRACE 171 + O V TRACE 171
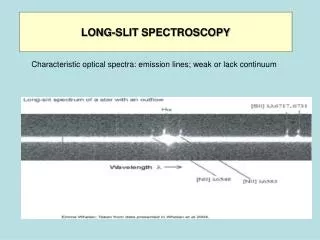
Fourier power maps Power significant to 95% 3 min band (4.7 – 6.6 mHz) (150 – 210 s) 3-min umbral oscillations Beckers & Tallant (1969), Gurman (1982), Fludra (2001), Brynildsen (2002)
3 min He I time series • He I oscillation amplitude ~2% • FFT has 2 dominant periods ~ (6.1 & 7.1) mHz (140 & 160) Seconds
3 min O V time series • O V oscillation amplitude ~4% • FFT has 2 dominant periods ~ (5.9 & 7.3) mHz (140 & 170) Seconds
AR 10570 with TRACE ~80 kms-1 projected velocity cf. De Moortel et al. (2002) Robbrecht et al. (2001)
3 min TRACE 171 time series • TRACE oscillation amplitude ~3% • FFT has 3 dominant periods ~ (3, 5.9 & 7.3) mHz (330, 140 & 170) Seconds
Conclusions • Chromospheric/TR Acoustic Waves (Brynildsen, 2004) • Waves propagate through chromosphere, TR and into the corona • 3 min oscillations above sunspot umbra in the Chromosphere & TR where the umbral magnetic field is vertical • Oscillations observed as 3 min propagations at TRACE temperatures where the field is more inclined.
Acoustic Energy Flux • Assuming acoustic waves with velocity and pressure perturbations V' and P' • The energy flux of the wave ε is given by: Assuming: • Optically thin emission → • Ideal gas • Complete ionisation of the plasma & Relative abundances X=0.9 Y=0.1 → The energy flux of the wave is given by:
Acoustic Energy Flux O V Doyle (2003) derive Ne in sunspot plumes using O V diagnostic TRACE 171 Del Zanna (2003) derive Ne in the footpoints of quiescent coronal loops He I Estimated Log Ne=11cm-3 for active regions
Conclusion • Acoustic waves propagate through chromosphere, TR and into the corona • Acoustic waves are insufficient to heat active regions • Technique may be used as a seismological tool to determine plasma properties ρ, T,… • If ε constant through the atmosphere; may allow derivation of Ne at He I temperatures • Need active region Ne measurement at He I temperatures