Download
1 / 33
330 likes | 338 Views
System Modelling with. UML. objectives Describe Unified Modeling Language (UML) in the context of Requirements Specification Re-visit use case, class, object and sequence diagrams Describe collaboration, statecharts, activity, component and deployment diagrams.

E N D
System Modelling with UML objectives Describe Unified Modeling Language (UML) in the context of Requirements Specification Re-visit use case, class, object and sequence diagrams Describe collaboration, statecharts, activity, component and deployment diagrams
Popular Design and Modelling Tool UML • Large systems are easier to understand when you break them down into subsystems • Good modelling techniques are increasingly important as the size and complexity of systems increase • Good models promote communication among technical and non-technical workers while ensuring good solutions requires organisation and planning • An Object-oriented perspective.
About it… • Was created at Rational Software by Booch, Jacobson, and Rumbaugh. The Object Management Group adopted UML as a standard in 1997. • Is a standard way to specify, construct, and document systems that use OO methods • Systems you model may be implemented in an OO programming language like Java, C++, C# • As with flowcharts, pseudocode, hierarchy charts and class diagrams, UML has its own conventions and symbols • You can the entire specification and usage guidelines from the OMG at www.omg.org/uml/
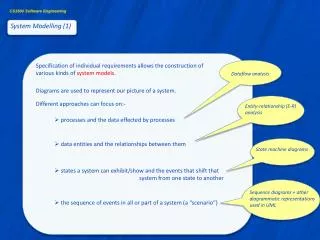
Use to create top view diagrams of business processes that let you hide detail and focus on functionality Useful with customers who are not technically oriented Each type of diagram allow you to see a process from a different angle Diagram Types: Use case diagrams Class diagrams Object diagrams Sequence diagrams Collaboration diagrams Statechart diagrams Activity diagrams Component diagrams Deployment diagrams UML Diagrams
Those that illustrate the dynamic, or changing, aspects of a system, and Those that illustrate the static, or steady aspects of a system Dynamic: Use case diagrams, Sequence diagrams, Collaboration diagrams, Statechart diagrams, Activity diagrams UML diagrams classification • Static: • Class diagrams, • Object diagrams, • Component diagrams, • Deployment diagrams.
Use case Diagrams • Shows how a system works for the perspective of those who approach it from the outside or use it • This includes many types of uses: • Employees, customers, suppliers • Governments, private organisations, machines or other systems • Easier to think of them as users, hence the term actors
Use case diagram for Librarian librarian acquireNewBook() checkOutBook() • Represent system functions or services that are visible to the actor • Represent cases for which actors interact with system or benefit from it • Determining all cases help divide a system logically into functional parts • Establishing use cases usually follows from analysing the main events in a system
Variations of use cases • Extend • Is a use case that shows functions beyond those found in the base case • Include • When a use case can be part of multiple use cases (similar to subroutine or submodule) • Generalisation • When a use case is less specific that others and you want to be able to substitute the more specific for a general one
<<Extend>> librarian acquireNewBook() checkOutBookforNewUser() <<extend>> checkOutBook() • Example: • Checking out a book for a new library user is slightly more complicated that checking a book out for an existing user
<<include>> librarian acquireNewBook() checkOutBookforNewUser() <<extend>> checkOutBook() <<include>> <<include>> registerNewUser() issueLibraryCard() • Example: • Issuing a library card might be a function of checkOutBook() when library user is new • It might also be a function of registerNewUser()
Use case diagram for Librarianwith Generalisations acquireNewVideo() librarian acquireNewJournal() acquireNewBook() checkOutBookforNewUser() <<extend>> checkOutBook() <<include>> <<include>> registerNewUser() issueLibraryCard() • Example: • A librabry has procedures for acquiring new material, acquireNewItem() is a generalisation of acquiring specific items
Use case diagram for Librarianwith multiple actors librarian acquireNewVideo() acquireNewJournal() acquireNewBook() checkOutBookforNewUser() <<extend>> checkOutBook() clerk <<include>> <<include>> registerNewUser() issueLibraryCard() • Example: • A library clerk cannot perform as many functions as a librarian; the clerk can check out books and register new library users but cannot acquire new materials.
Use case diagram emphasizing actors Library user Library staff checkOutBook() checkOutVideo() Adult user child user checkOutReferenceMaterials() clerk librarian Cooperating library
Use case diagram emphasizing System Requirements Library System checkOutMaterials() Library staff RemoveOldMaterialsFromSystem() acquireNewMaterials() Library user reshelveReturnedMaterials() Cooperating library
You can use a class diagram to illustrate the names, attributes, and methods of a class or a set of classes Class diagrams are more useful to programmers (than users) because they resemble code to be developed LibraryItem idNum Title author create() getInfo() Book Video author runningTime create() getInfo() create() getInfo() rewind() Showing Generalisation Class and Object Diagrams
Class Diagram with association relationship Library LibraryItem idNum Title Name directorName Address phoneNumber 1 0..* create() getInfo(idNum) create() getInfo() 0..5 1 0..1 LibraryUser idNum Name Address 0..* create() getInfo(idNum) borrowItem() • An association relationship describes the connection or link between objects that often includes information about cardinality • Example: • one Library object exists and it can be associated with any number of LibraryItem and LibraryUser. A LibraryUser can borrow up to 5 items.
Class Diagram with whole-part relationship Library Name directorName Address phoneNumber create() getInfo() PersonnelDept ReferenceDept deptName Director phoneNo deptName Director phoneNo • A whole-part (has-a) relationship describes an association in which one or more classes make up parts of a larger class (aggregation)
Object Diagrams • Are similar to Class Diagrams, but they model specific instances of classes Library LibraryItem Name: University of Khartoum directorName: Mustafa Deng Address: Gam3a Street phoneNumber: 83 777777 idNum: 23456 Title: Software Engineering create() getInfo() LibraryUser idNum: 19564 Name: Rana Salah Address: XXXX
Sequence and Collaboration Diagrams • You use a sequence diagram to show the timing of events in a single use case • the x-axis represents objects, starting from left with object or actor that begins the action • Vertical lines represents the period of time the object exists • the y-axis represents time, horizontal lines along it show how objects communicate • Collaboration diagrams emphasize the organisation of objects that participate in a system • Similar to sequence diagrams except that it contains sequence numbers to represent the precise order of activities • They show the relationships between the objects and the order of messages passed between them
Sequence of events from sequence diagram Librarian BookCheckOutRecord LibraryUser Book 1.1 getInfo(idNum) 1.2 (userInfo) 1. create(User idNum, Book idNum 1.3 getInfo(idNum) 1.4 (bookInfo) 2. (checkOutRecord)
Librarian 1. create(User idNum, Book idNum BookCheckOutRecord 1.3 getInfo(idNum) 2. checkOutRecord() 1.1 getInfo(idNum) 1.2 userInfo() 1.4 bookInfo() LibraryUser Book Example: Collaboration Diagram • Collaboration diagram uses the free-form arrangement of objects as found in an Object diagram, it is a cross between an object diagram and a sequence diagram. The diagram makes it easier to see all interactions involving a particular object.
Statechart Diagrams State diagram for class Book returned() returned() … not borrowable … borrowable borrowed()[last copy] borrowed()[not last copy] guard expression • These show statuses (changes in behaviour) of a class or object at different points in time. • Example:
Activity Diagrams userRequest() Library Owns Book Library doesn’t Own Book contactInterLibraryLoan() retrieveBook() checkOutBook() • Resembles flowcharts showing the flow of actions of a system: • Uses flowchart start and stop symbols • Use empty diamonds to represent decisions
Activity Diagrams: Fork and Join memberLibraryRequestBook() queryGezeriaULibrary() queryJubaULibrary() querySudanULibrary() sendBookToRequestingLibrary() • Many real-life systems contain activities that occur simultaneously • A fork is similar to decision but defines all branches • A join reunites control flow after a fork
Component and Deployment Diagrams • These model physical aspects of systems: • Component diagrams emphasize the files, database file, documents, and other components that a system’s software uses • Deployment diagrams focus on a system’s hardware • You use a variety of icons to symbolize software or hardware components. • Examples: Internet Request Table Database Console Server Printer
Internet Request Internet Request Database Filled when a part can belong to only one whole at a time; Open when it can belong to several Example: Component Diagram Library User table Book table
Example: Deployment Diagram Console Console Console Printer Internet Server A Server B
Component Diagrams in Design and Implementation • Describes the dependencies between various software components, such as executable files, documents, and source files. • A component is represented using a rectangular box, with two rectangles protruding from the left side • A Dependency is used to model the relationship between two components. The notation for a dependency relationship is a dotted arrow, pointing from a component to the component it depends on. Component
Deployment Diagrams in Design and Implementation • Models the hardware used in implementing a system and the association between those hardware components. Components can also be shown on a Deployment diagram to show the location of their deployment. • A node represents a piece of hardware in the system. This entity is represented by a three-dimensional cube. • An association, drawn as a solid line between two Nodes, indicates a line of communication between the hardware elements. Node name
Examples Deployment diagram: • showing that the SiteConfig component is deployed onto the Web Server and the BaseDB component is deployed on an App Server. You can also determine that the Web Server communicates with the App Server, and the App Server communicates with the Database Server and a Printer.
Examples • Component diagram: identifies the MyWebComps assembly as being dependent on the BaseDB and SiteConfig source files. • You can use stereotyped icons for components instead of the standard icon
Deciding which UML Diagrams to use • Each provide a different view of a system • Different users have different preferences • The most important reason you use any diagram is to communicate clearly and efficiently with the people for whom you are designing the system