Download
1 / 14
140 likes | 317 Views
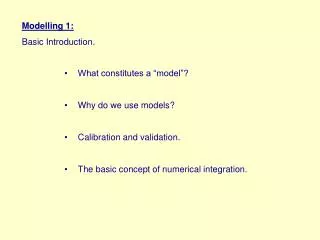
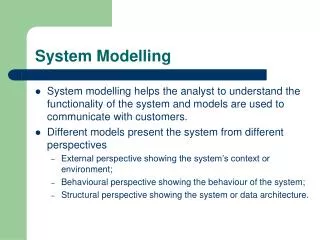
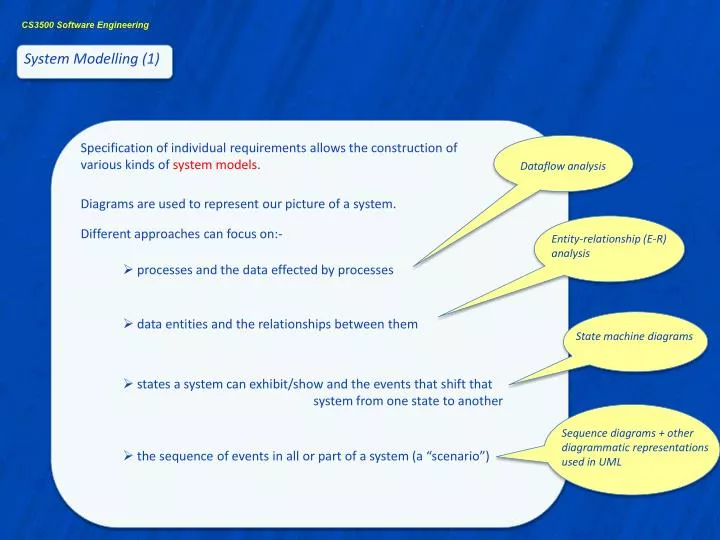
System Modelling (1). Specification of individual requirements allows the construction of various kinds of system models . . Dataflow analysis. Diagrams are used to represent our picture of a system. Different approaches can focus on:-. Entity-relationship (E-R) analysis.

E N D
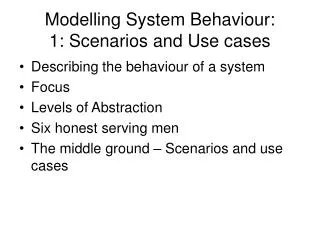
System Modelling (1) Specification of individual requirements allows the construction of various kinds of system models. Dataflow analysis Diagrams are used to represent our picture of a system. Different approaches can focus on:- Entity-relationship (E-R) analysis • processes and the data effected by processes • data entities and the relationships between them State machine diagrams • states a system can exhibit/show and the events that shift that • system from one state to another Sequence diagrams + other diagrammatic representations used in UML • the sequence of events in all or part of a system (a “scenario”)
System Modelling (2) Dataflow analysis 1 A dataflow diagram (DFD) represents all or part of a system in an abstract (non-physical) way using just 4 symbols Dataflow – data in motion. A “pipe” – unidrectional flow. A Process – an actvity that effects data or The dataflow arrow does NOT mean “Go To” or External Entity - external source or destination of system data Datastore – data of the same type (an entity) Stationary data
System Modelling (3) Dataflow analysis 2 Process ID, e.g P1 or P2.1 Dataflow contents e.g. amount_owing Dataflow Process name, e.g Verify_Pin Process Name of EE e.g. Supplier Datastore name e.g.Accounts Datastore ID, e.g D2 Datastore External entity
System Modelling (4) Dataflow analysis 3 Dataflow analysis allows a system to be progressively “discovered” by “levelling” High-level context diagram Purchasing System Reorder System warehouse A context diagram puts the system in context in relation to related EE’s
System Modelling (5) Dataflow analysis 4 Level 0 DFD Purchasing System D1 inventory P1 P2 Transaction_details warehouse Process_ stock_ transaction exception_report Produce_ ReOrder_List ReOrder_detail D2 ReOrders ReOrder_detail
System Modelling (6) Dataflow analysis 5 Level 1 DFD of P1 exception_ report P1.2 P1.1 stock_id, trans_qty ReOrder_detail D1 D1 inventory transactions stock_id, trans_qty trans_details Get_trans valid_flag, trans_qty Purchasing System Validate_trans warehouse warehouse P1.3 P1.4 valid_trans valid_trans Update_ inventory Create_reorder P2 Produce_ ReOrder_List D2 ReOrders trans_details trans_details reject_ note ReOrder_detail Taking P1 to Level 1 has “exploded “ 1 process into 4 smaller ones
System Modelling (7) Dataflow analysis 6 Levelling should continue until an individual process need be decomposed no further – it is in a primitive form with probably no more than one dataflow output and whose logic could be described in a “short” piece of PDL Note that if the top-level DFD had 8 processes and each of these processes was taken through 2 levels of decomposition, each yielding another 8 sub-processes, then our system would end-up with 512 primitive Processes (8 x 8 x 8) There is no rule about how many levels are required but 2 to 3 levels is usually adequate and not all processes need to be taken down to the 3rd level. (from Hawryszkiewycz, Systems Analysis & Design)
System Modelling (8) Entity-Relationship Modelling 1 Man_Name Dept_ID Man_No Attributes . . . Fin 3 Merkel,A Separate instances (occurrences) of the entity Health 5 Obama, B Entity set Note that a relationship can have its own attributes . . . . . . . . . Manager Man_StartDate Man_Budget Proj_Code Man_No . . . [n] 31/1/11 RK1 3 11000 5 Separate instances (occurrences) of the relationship 8000 RK2 5/1/11 manages RK3 32000 9/5/11 5 15000 7/3/11 Relationship set 3 RK4 1 Proj_Code Proj_Name Tot_Budget Start_Date Proj_Locn Fin_Date . . . Project RK1 ABC Loc4 40000 30/4/11 1/10/10 7/8/10 9/3/11 RK2 50000 Loc9 DEF RK3 IJK Loc8 1/1/11 5/7/11 90000 Entity set Loc5 8/9/11 70000 RK4 XYZ 8/9/10
System Modelling (9) Entity-Relationship Modelling 2 Mapping a complete system using the E-R approach (from Hawryszkiewycz, Systems Analysis & Design)
System Modelling (10) State Machine Models 1 Nodes represent system states • A state machine diagram shows how a system • responds to internal or external events. • It does not show the flow of data within the • system • Often used for modelling real-time systems • because these systems are often driven by • stimuli from the system’s environment Arcs represent events that shift the system from one state to another
System Modelling (11) State Machine Models 2 A state machine diagram for a microwave oven
System Modelling (12) Sequence Diagrams 1
System Modelling (13) Sequence Diagrams 2 Several different types of diagrams are available within UML for representing different aspects of OO. Sequence diagrams are dynamic models that show the sequence of object interactions that take place. A sequence diagram showing operations involved in collecting data from a weather station summarise (report) The objects are: :CommsController :WeatherStation :WeatherData Time is represented vertically Thin rectangle represents time when object is the controlling object in system
System Modelling (14) Sequence Diagrams 3 1 Object that is an instance of CommsController receives a remote request to send a weather report. It acknowledges receiving this request. 2. This object sends a message to an object that is an instance of WeatherStation to create a weather report. The instance of CommsController suspends itself. 3 WeatherStation sends a message to WeatherData to summarise the weather data 4 Summary is computed and control returns to the WeatherStation object 5. The WeatherStation object sends a message to CommsController requesting it to transfer the data to the remote system. The WeatherStation object suspends itself 6. The CommsController object sends the report to the remote station, receives an acknowledgement, and then suspends itself waiting for the next request.