Download
1 / 33
330 likes | 338 Views
Using Biennial Report Data to Support the RCRA Program. 2010 RCRAInfo National Users Conference. Laura Lopez EPA – Headquarters Office of Resource Conservation and Recovery. Background. At the last RCRAInfo conference, ORCR presented some new analyses using the 2007 Biennial Report (BR) data

E N D
Using Biennial Report Data to Support the RCRA Program 2010 RCRAInfo National Users Conference
Laura LopezEPA – HeadquartersOffice of Resource Conservation and Recovery
Background • At the last RCRAInfo conference, ORCR presented some new analyses using the 2007 Biennial Report (BR) data • Extensive national QA/QC effort to clean up the data • For reporting year 2009, EPA is planning to supplement the National Report with several analyses that include: • Trending hazardous waste generation and management over the years 2005, 2007, and 2009 • Targeting facilities that have the potential to recycle waste streams • Evaluating the RCRA Program
Data, Information, Knowledge, Wisdom Available at http://www.nwlink.com/~donclark/performance/understanding.html
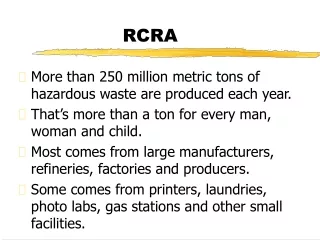
Step 1 - Gathering Data • The current BR data in RCRAInfo is over 20 billion characters. • Need reliable, quality data to make good decisions • The revised “State BR Summary Reports” and the new “BR Reporting Guidance” help support data quality. • The data reflects the complexities of the RCRA program.
Step 2 - Transforming Data into Useful Information • To transform the raw hazardous waste data into information, we need to search for the hidden patterns. • Examples of BR data mining can include categorizing according to: • RCRA Waste code; Waste form; Source of generation; Type of management; Industrial sector; Chemicals in waste streams; and any combination of the above categories • The algorithms used to aggregate similar pieces of data are defined in a document titled “Analytical Rules and Principles”.
Information about Generated Quantity of All Hazardous Wastes in 2005 and 2007 15,810 Generators 15,980 Generators 35.4 32.3 Waste Quantity (million tons) • Nonwastewaters • Wastewaters Year Source: 2007 Biennial Report – GM Generation Forms
Quantity of Hazardous Waste by Source of Generation in 2005 and 2007 Production Process Wastes 14,376 Generators 14,445 Generators 30 26.2 24.9 4.2 Generation of Waste in 2007 3.9 20 Waste Quantity (million tons) 22.0 10 21.0 0 2005 2007 Year • Nonwastewaters • Wastewaters Clean-Up Wastes Treatment Residuals 3,368 Generators 3,384 Generators 2,007 Generators 1,981 Generators 1.2 10 1.1 8.1 8 6.9 0.8 2.7 6 0.8 2.8 Waste Quantity (million tons) Waste Quantity (million tons) 0.5 4 0.4 5.4 0.4 4.1 2 0.3 0.1 0 0 2005 2007 2005 2007 Year Year Source: 2007 Biennial Report – GM Generation Forms
Management of Production Process Wastes in 2005 and 2007 Production Process NonwastewatersOffsite Management Production Process NonwastewatersOnsite Management 2.0 1.2 1.6 Managed Waste Quantity (million tons) 0.8 1.2 Managed Waste Quantity (million tons) 0.8 0.4 0.4 0 0 2005 2007 2005 2007 3% 7% Year Year 4% • Solvents Recovery • Other Recovery • Metals Recovery • Energy Recovery • Landfill • Incineration • Deepwell or Underground Injection • Wastewater Treatment • Onsite Nonwastewater • Offsite Nonwastewater • Offsite Wastewater • Onsite Wastewater Management of Production Process Waste in 2007 Production Process WastewatersOnsite Management Production Process WastewatersOffsite Management 86% 25 1.2 20 0.8 Managed Waste Quantity (million tons) 15 Managed Waste Quantity (million tons) 10 0.4 5 0 0 2005 2007 2005 2007 Year Year Source: 2007 Biennial Report – GM Onsite and Offsite Forms
Distribution of Production Process Nonwastewaters Managed Offsite in 2007 36% 13% 10% 8% 8% 6% Sources: 2007 Biennial Report – GM Onsite and Offsite Forms ORCR's Draft Export/Import Database
Targeting Facilities That Can Potentially Recycle Their Electric Arc Furnace Dust
Generators Sending K061 to Metals Recovery, Landfilling, and Both in 2007 Metals Recovery only:300,000 tons (30%);35 generators (35%) Both methods: Landfill = 300,000 tons (30%); Metals Recovery = 82,000 tons (8%); 33 generators (33%) Landfill only:330,000 tons (33%);32 generators (32%) Sources: 2007 Biennial Report – GM Onsite and Offsite Forms ORCR's Draft Export/Import Database
Generators and Managers of K061 Production Process Nonwastewaters, 2007 Sources: 2007 Biennial Report – GM Onsite and Offsite Forms and WR Forms
Step 3 - Applying Knowledge to Information about K061 Management “Why” does some K061 go to landfilling while some goes to recovery? • Economic factors affect the management decisions for K061 • Price of fuel for smelting affects recovery costs • Distance to landfills and metals recovery facilities affect transportations costs • State policies and taxes can influence landfilling costs • Composition of waste stream – high zinc/low zinc • Lead concentration in the waste stream affects potential for recovery • Public pressure and corporate policies
Step 4 - Apply Wisdom to the Knowledge about K061 Management Decisions “How” could the RCRA program encourage more recycling of K061? • Develop strategies to reduce the lead in scrap metal • Research the feasibilities of reducing lead in manufactured products that can enter the ferrous metal scrap stream • Educational outreach • Public recognition programs • Work with ORD to develop hydrometallurgical technologies • Study the affects of DSW and State taxes on waste sent to landfills
Jim O’LearyEPA – HeadquartersOffice of Resource Conservation and Recovery
Targeting Facilities That Can Potentially Recycle Their Solvents
Targeting Facilities That Can Potentially Recycle Their Solvents Part 1 – Big Picture Part 2 – Targeting Potential Facilities
Scope of Analysis • Spent solvents listed because of their toxicity and/or ignitability (Waste Code Groups F001, F002, F003, F004 and F005). • Mixtures of those listed spent solvents (Waste Code Group F1_5) • Spent solvents that fail ignitability characteristic (Waste Code Group D001)
Part 1- Big Picture • Most solvent wastes generated are of three types: ignitable only (F003), F-listed solvent mixtures (F1_5), and characteristically ignitable (D001) Source: 2007 Biennial Report – GM Generation Forms
Most Generators (98%) Manage Their Wastes Offsite… Number of Solvent Generators Managing Onsite and Offsite in 2007 by Waste Code Group Source: 2007 Biennial Report – GM Onsite and Offsite Forms
… And therefore, Most of the Waste Generated (79%) is Managed Offsite Volume of Solvents Managed Onsite and Offsite in 2007 by Waste Code Group (Tons) Source: 2007 Biennial Report – GM Onsite and Offsite Forms
There Appears to be Plenty of Opportunity to Recycle Spent Solvents Managed Volume and Number of Generators of Solvents in 2007 by Management Method Source: 2007 Biennial Report – GM Onsite and Offsite Forms
Pharmaceutical and Paint/Coatings Industrial Sectors Appear to Dominate Solvent Waste Generation Source: 2007 Biennial Report – GM Onsite and Offsite Forms
Part 2 – Targeting Potential Facilities The number of facilities entering and leaving BR reporting is dynamic Source: 2007 Biennial Report – GM Onsite and Offsite Forms
Paint/Coatings Sector Facilities have a Higher Propensity to Recycle their Spent Solvents Source: 2007 Biennial Report – GM Onsite and Offsite Forms
The Larger the Volume of Solvent Waste Generated, the Higher the Propensity to Recycle their Spent Solvents Source: 2007 Biennial Report – GM Onsite and Offsite Forms
So, Why Aren’t These Guys Recycling? Source: 2007 Biennial Report – GM Onsite and Offsite Forms
Relationship of Onsite F1_5 Waste Management Practices to Price of Oil and Natural Gas in 2007 Source: 2007 Biennial Report – GM Onsite Forms
Relationship of Offsite F1_5 Waste Management Practices to Price of Oil and Natural Gas in 2007 Source: 2007 Biennial Report – GM Offsite Forms
Factors Influencing Propensity to Recycle • Volume of waste generated • Distance to recycling facility vs. other waste management facility • Quality of waste solvent generated • Cost of petroleum
Next Steps • Incorporate 2009 BR data into the analyses • Consider development of BR data analyses on a State by State basis • Send to the Change Management Process Waste Activity Group for review and comment • Complete National review of BR data analyses through the RCRAInfo Change Management Process • Revise the BR data analyses based on comments received from States, Regions, and other Headquarter Offices • Finalize the BR data analyses and post the document on EPA’s Web site with the 2009 National Report