Download
1 / 27
270 likes | 380 Views
Linking FIA Data and Satellite Imagery to Build a Habitat model for the Marbled Murrelet. Martin G. Raphael Pacific Northwest Research Station Funding contributed by: Region 6, USFS, PNW Research Station USDI Fish and Wildlife Service. Northwest Forest Plan of 1994.

E N D
Linking FIA Data and Satellite Imagery to Build a Habitat model for the Marbled Murrelet Martin G. Raphael Pacific Northwest Research Station Funding contributed by: Region 6, USFS, PNW Research Station USDI Fish and Wildlife Service
Northwest Forest Plan of 1994 • Conservation plan for older forests and species on 57 mill. ac. of federal land • Effectiveness Monitoring modules for older forest, n. spotted owl, marbled murrelet, watershed condition • Key questions for monitoring older forest: • How much, how is it changing, how might it change in the future? • Is the Plan providing for its conservation and management? Physiographic provinces (57 mill. ac., 46 mill. ac forest) USA
A primary objective of the Northwest Forest Plan was to achieve: “maintenance and/or restoration of habitat conditions for the Northern Spotted Owl and the Marbled Murrelet that will provide for viability of each species -- for the owl, well distributed along its current range on federal lands, and for the murrelet so far as nesting habitat is concerned” --FEMAT 1993:iv
Objectives • Estimate amount and distribution of murrelet nesting habitatin WA, OR, CA • Estimate change over time – from start of plan to now • Make estimates over all lands within the murrelet range in WA, OR, CA • Use existing sources for environmental variables (e.g., IMAP, PRISM)
Needs for regional vegetation information • Methods that integrate plot and remotely sensed data to provide info.: • Consistent over large, multi-ownership regions (“all lands”) • Spatially explicit (mapped) • Detailed attributes of forest composition and structure • Support integrated landscape analyses of multiple forest values • Latest challenge: provide trend information that is spatial • Monitoring older forest for Northwest Forest Plan
Effectiveness Monitoring for Late-Successional and Old-Growth Forest (LSOG) • Objective: develop tools and data to assess change in older forest • Gradient nearest neighbor (GNN) imputation (maps of detailed forest attributes) • Change detection from Landsat time series (LandTrendr) (trends) • Approach: minimize sources of error in models, map real change • Corroborate with sample-based estimates • Monitoring report every 5 years • 10-year report (Moeur et al. 2005) • In progress: 15-year report • 1996 to 2006 (Wash. and Oreg.), 1994 to 2007 (Calif.) * Moeur, M., et al. 2005. Northwest Forest Plan–The first 10 years (1994-2003): status and trend of late-successional and old-growth forest. Gen. Tech. Rep. PNW-GTR-646.
1 2 3 4 7* 5 6 8 9 10 11 12 13 Oregon Accuracy assessment (‘obsessive transparency’) local (1-ha plot) scale • Local- (plot-) scale accuracy via cross-validation: • Confusion matrices, kappa statistics, root mean square errors, scatterplots, etc. • Landscape- to regional-scale accuracy: • Area distributions in map vs. plot sample • Range of variation in map vs. plot sample • Riemann et al. (2010) diagnostics • Bootstrap variance estimators for kNN (Magnussen et al. 2010) • Spatial depictions of uncertainty: • Variation among k nearest neighbors • Distance to nearest neighbor(s) (sampling sufficiency) • ‘Look-and-feel’ issues landscape- or watershed- scale regional scale
LSOG change from GNN ‘bookend’ maps, 1994/6 to 2006/7 • GNN models and change at 30-m pixel scale • Recommend summarizing to coarser scales • Example: 10-km hexagons LSOG change (% of forest)
Change in habitat suitabilityNWFP Effectiveness Monitoring Northern spotted owl Marbled murrelet • Maxent (machine learning) models based on forest structure and composition attributes from GNN, trained with nest location data • Subtract models to get change
Modeling Marbled Murrelet Nesting Habitat: Estimating Nesting Habitat Suitability
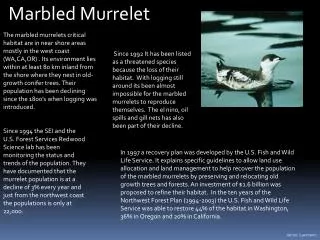
Natural History • Fish-eating seabird • Distributed along West coast S to Monterey Bay • Nests on limbs of big conifers • Nests within 20 to 50 km from shore
Model Form • Presence/available • Presence = set of murrelet nests plus equal number of “occupied” sites • Available = entire landscape within study region that is “capable” of being habitat • We masked out barren lands, non-forested areas
Variable selection • Team developed initial list from available data based on experience, literature • Variables must cover range • Used GNN for forest attributes • PRISM for climate variables • DEM for slope, aspect • Ran correlations, dropped one if r > 0.9 • Kept variable with better support in literature
Platforms per Tree (all species)We used these data to derive a new variable from the GNN data
Murrelet population size in relation to amount of nesting habitat
Is amount and trend of nesting habitat a primary driver of population trend? • Spatial distribution of murrelets is well-predicted by spatial distribution of habitat • Habitat trend is not as clear, but suggest a possible correlation • If marine conditions are the driver, we’d expect similar trends among other related birds and we don’t see such trends
Sources of uncertainty in overall monitoring results • Multiple estimates, lots of moving parts with different limitations • Map- and plot-based estimates can’t be compared statistically • Look for corroboration • Complexity and uncertainty pose challenges for users • Error in model-based estimates • Error in plots, spatial predictors; model specification; etc. • Limitation of Landsat for mapping LSOG recruitment • Time period is short (10-13 years), and data will improve • Uncertainty associated with murrelet habitat definition: • Habitat attributes can be affected by one or a few trees • Disturbance can create habitat gain, habitat loss, or no change
Products from NWFP monitoring study • GNN models and diagnostics available for download • 2006/7 and 1994/96 vegetation maps and accuracy assessments • 15-year reports (PNW GTRs) published or in press: • LSOG, northern spotted owl, marbled murrelet, watershed condition