Download
1 / 48
480 likes | 746 Views
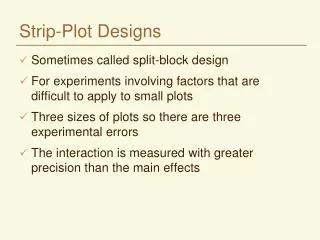
A Strip Plot Gets Jittered into a Beeswarm. by Shane Rosanbalm. Outline. Some preliminaries Describe what a beeswarm plot is Introduce the %beeswarm macro Demonstrate the simplest use case Explain how it works under the covers Demonstrate more complex use cases If time remains

E N D
A Strip Plot Gets Jittered into a Beeswarm by Shane Rosanbalm
Outline • Some preliminaries • Describe what a beeswarm plot is • Introduce the %beeswarm macro • Demonstrate the simplest use case • Explain how it works under the covers • Demonstrate more complex use cases • If time remains • Discuss the JITTER option in 9.4 • Demonstrate a paneled beeswarm plot
Some dummy data data dummy; do trt = 1 to 3; do subjects = 1 to 30 - 4*trtby 1; response = sqrt(trt)*(rannor(1)+3); output; end; end; run;
How many circles can we squeeze onto a scatter plot? data fill; do y = 0 to 30; do x = 0 to 40; output; end; end; run; procsgplot data=fill; scatter x=x y=y; run;
How many circles can we squeeze onto a scatter plot? data fill; do y = 0 to 75; do x = 0 to 100; output; end; end; run; procsgplot data=fill; scatter x=x y=y; run;
How many circles can we squeeze onto a scatter plot? data fill; do y = 0 to 60; do x = 0 to 80; output; end; end; run; procsgplot data=fill; scatter x=x y=y; run;
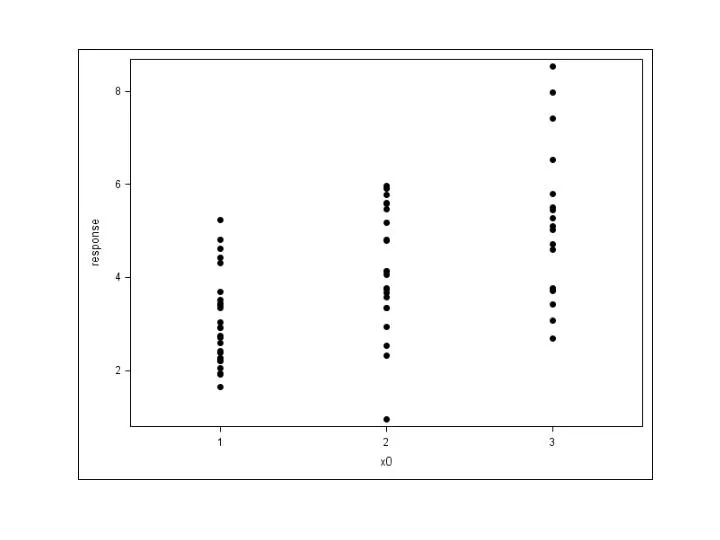
Code for a strip plot procsgplot data=dummy; scatter x=trt y=response / markerattrs=(symbol=circlefilled); xaxis min=0.5 max=3.5 integer; run;
Code for a jittered strip plot data jitter; set dummy; trt_jit = trt - 0.05 + 0.1*ranuni(1); run; procsgplot data=jitter; scatter x=trt_jit y=response / markerattrs=(symbol=circlefilled); xaxis min=0.5 max=3.5 integer; run;
Code for a beeswarm plot %beeswarm(data=dummy ,respvar=response ,grpvar=trt ); procsgplotdata=beeswarm; scatter x=trt_bee y=response / markerattrs=(symbol=circlefilled); xaxis min=0.5 max=3.5 integer; run; The macro creates a new variable named TRT_BEE
How to use the %beeswarm macro • Required Inputs: • A dataset (data=) • A response (or y) variable (respvar=) • A grouping (or x) variable (grpvar=) • Outputs: • A dataset (out=beeswarm) • This output dataset is a near copy of the input dataset, with one additional variable having been added: &grpvar._bee
Code and output %beeswarm (data=dummy ,respvar=response ,grpvar=trt ); procsgplotdata=beeswarm; scatter x=trt_beey=response / markerattrs=(symbol=circlefilled); xaxis min=0.5 max=3.5 integer; run;
How the macro works • Assume (for the moment) that we are producing a graph using SGPLOT with all default settings • Width: 640px • Height: 480px • Marker size: 7px
How the macro works • We want to use the distance formula to avoid overlays • Two circles of the same diameter will not overlay if the distance between their centers is greater than their diameter What is the diameter of a default circle marker?
How many circles can we squeeze onto a scatter plot? data fill; do y = 0 to 60; do x = 0 to 80; output; end; end; run; procsgplot data=fill; scatter x=x y=y; run;
Scale X and Y values based on the number of markers that fit on a graph Response correction - (max-min)/60 Grouping correction - ngrps/80 Now the X and Y values are in the same scale, and the units correspond to the diameter of a circle
Softening the “Default” Assumption • More markers fit on a page if you: • Increase width, • Increase height, • Decrease marker size • Fewer markers fit on a page if you: • Decrease width, • Decrease height, • Increase marker size
Change from 640px by 480pxto 2.5in by 2.5in 80 and 60 no longer work as correction factors
How many markers fit 2.5in by 2.5in? data fill; do y = 0 to 35; do x = 0 to 35; output; end; end; run; ods graphics / width=2.5in height=2.5in; procsgplot data=fill; scatter x=x y=y; run;
Optional Arguments • rmarkers= • number of markers that will fit in the response/continuous direction; default=60 • gmarkers= • number of markers that will fit in the grouping/categorical direction; default=80
rmarkers=/gmarkers= put to use %beeswarm(data=dummy ,respvar=response ,grpvar=trt ,rmarkers=35 ,gmarkers=35 ); ods graphics / width=2.5in height=2.5in; procsgplot data=beeswarm; scatter x=trt_bee y=response / markerattrs=(symbol=circlefilled); xaxis min=0.5 max=3.5 integer; run;
Bounding tick marks Because the response correction is based on (max-min), forcing a larger axis range causes overlays
Optional Arguments • rmin= (response axis minimum) • rmax= (response axis maximum) %beeswarm(data=dummy ,respvar=response ,grpvar=trt ,rmarkers=35 ,gmarkers=35 ,rmin=0 ,rmax=10 ); ods graphics / width=2.5in height=2.5in; procsgplot data=beeswarm; scatter x=trt_bee y=response / markerattrs=(symbol=circlefilled); xaxis min=0.5 max=3.5 integer; yaxis min=0 max=10; run;
In summary • The beeswarm plot improves upon the jittered strip plot. • Only move points when necessary. • Only move the minimum distance. • The %beeswarm macro does not create a plot, it adds a variable to a dataset. • The programmer then uses this variable in a scatter plot. • Use rmarkers= and gmarkers= to adjust for non-default dimensions. • Use rmin= and rmax= to adjust for bounding tick marks.
Enrichment #1: the JITTER option procsgplot data=dummy; scatter x=trt y=response / jitter markerattrs=(color=black); xaxis min=0.5 max=3.5 integer; run;
JITTER with a discrete x-axis data dummyc; set dummy; trtc = put(trt,1.); run; procsgplotdata=dummyc; scatter x=trtc y=response / jitter markerattrs=(color=black); run;
JITTER with more discrete y-values data rounded; set dummyc; rounded = round(response,0.1); run; procsgplot data=rounded; scatter x=trtc y=rounded / jitter markerattrs=(color=black); run;
A paneled strip plot data dummy_panel; do panel = 1 to 3; do trt = 1 to 3; do subjects = 1 to 30 - 4*trt*floor(sqrt(panel)) by 1; response = sqrt(trt)*sqrt(panel)*(rannor(1)+3); output; end; end; end; run; procsgpanel data=dummy_panel; panelby panel / columns=3; scatter x=trt y=response / markerattrs=(symbol=circlefilled); colaxis min=0.5 max=3.5 integer; run;
Do a fit test for rmarkers= and gmarkers=. data fill; do panel = 1 to 3; do y = 0 to 75; do x = 0 to 35; output; end; end; end; run; procsgpanel data=fill; panelby panel / columns=3; scatter x=x y=y; colaxisthresholdmax=0; rowaxisthresholdmax=0; run;
How to beeswarm paneled graphs? • Split the original dataset into 3 smaller datasets (one per panel). • Call the beeswarm macro 3 times (once per panel). • Stack the smaller beeswarm datasets back together into one large beeswarm dataset.
Call the macro once per panel %do i = 1 %to 3; data panel&i; set dummy_panel; where panel eq &i; run; %beeswarm(data=panel&i ,respvar=response ,grpvar=trt ,rmarkers=75 ,gmarkers=35 ,rmin=0 ,rmax=20 ,out=beeswarm&i ); %end;
Stack and plot databeeswarm; set %do i = 1 %to 3; beeswarm&i %end;; run; procsgpaneldata=beeswarm; panelby panel / columns=3; scatter x=trt_beey=response / markerattrs=(symbol=circlefilled); colaxis min=0.5 max=3.5 integer; run;
Contact Information • shane_rosanbalm@rhoworld.com • graphics@rhoworld.com