Download
1 / 30
300 likes | 385 Views
Effect of NO x emission controls on the long-range transport of ozone air pollution and human mortality. J. Jason West, Vaishali Naik, Larry W. Horowitz, Arlene M. Fiore. What is the effect of NO x reductions in one region, on ozone in all other world regions?.

E N D
Effect of NOx emission controls on the long-range transport of ozone air pollution and human mortality J. Jason West, Vaishali Naik, Larry W. Horowitz, Arlene M. Fiore
What is the effect of NOx reductions in one region, on ozone in all other world regions? Reduce anthropogenic NOx emissions by 10% in each of 9 world regions, in the MOZART-2 global CTM (MACCM3 meteorology, EDGAR emissions for 1990s). Naiket al. (JGR, 2005) used these simulations to show that NOx reductions in each region increase net RF.
Surface O3 Change from 10% regional NOx reductions Change in surface O3 (ppb), averaged over the 3-month period with highest population-weighted O3 in source region.
Effect of 10% regional NOx reductions Receptor Region Source Region Change in population-weighted O3 (ppt), averaged over the 3-month period with highest O3 in the receptor region.
Normalized source-receptor matrix Receptor Region Source Region Change in 3-month population-weighted average O3 per unit change in NOx emissions (ppb (Tg N yr-1)-1).
Example: Europe EU as source EU as receptor EU as receptor per Tg N Change in population-weighted O3, averaged over the 3-month period with highest O3 in the receptor region.
Example: North America NA as source NA as receptor NA as receptor per Tg N Change in population-weighted O3, averaged over the 3-month period with highest O3 in the receptor region.
Monthly O3 changes in each receptor region Panels for receptor regions, showing effects of 10% NOx reductions in each source region, for population-weighted monthly average O3.
Why greater sensitivity to changes in emissions in tropics and SH? ** Mainly due to decreased O3 production below 500 mb. Units are: Tg O3, Tg O3 (TgN yr-1)-1, Tg O3 yr-1 (TgN yr-1)-1 Source Region
Export greater Is ozone exported or NOy?
Effects on Metropolitan Regions Receptor Source Region Change in 3-month population-weighted average O3 (ppt).
Avoided Mortalities (annual) Receptor Region Source Region Mortality based on Bell et al. (2004) Intra-regional avoided mortalities: 5744; Inter-regional: 2600
Avoided Mortalities (annual) per Tg N yr-1 Receptor Region Source Region
Long-term changes in O3 via CH4 CH4 O3 OH EU as source O3 NOX EU as receptor EU as receptor per Tg N rapid local decadal global
Long-term changes in O3 via CH4 CH4 and long-term O3 increase per unit NOx decrease (global annual average surface O3 change) Tropical and SH regions have much greater effect on CH4 and long-term O3 per ton NOx reduced
Conclusions Based on 10% regional anthropogenic NOx emission reductions: Inter-continental effects are ~10x smaller than effects within a region. Largest impact is Europe on the Former Soviet Union. Control costs would need to be ~10% of within-region cost for overseas reductions to be cost-effective. Tropical regions cause a greater ∆O3 per ton NOx reduced, than temperate regions. Avoided mortalities are greater outside of NA, EU, and FSU than within. Long-term changes in O3 (via CH4) roughly cancel the short-term O3 reduction for some region pairs.
Global Background O3 Ozone Precursors Affect Both Ozone Air Quality and Climate Forcing O3 Free Troposphere hn NO NO2 OH HO2 Boundary layer (0-3 km) Direct Intercontinental Transport NMVOC, CO, CH4 NOx NMVOCs O3 NOx NMVOCs O3 CONTINENT 1 CONTINENT 2 OCEAN
Ozone Precursors Affect Both Ozone Air Quality and Climate Forcing CH4 O3 OH O3 NOX hn O3 NO NO2 O3 O3 CH4 VOCs, CO CH4 CH4 O3 O3 HO2 OH OH OH NMVOCs, CO, CH4 rapid local decadal global decadal global
Surface ozone changes due to 20% anthropogenic reductions Effect of global 20% anthropogenic emission reductions on 8-hr daily maximum surface O3, averaged over 3 month period with highest O3, at steady state (MOZART-2).
Ozone changesEffects of 20% reductions in anthropogenic emissions CH4 O3 OH Short term Long term Steady state = Short term + Long term Tropospheric O3 burden ∆O3srf annual average Short term Steady state ∆O3srf global population-weighted 8hr. 3-month O3 NOX
Radiative forcingEffects of 20% reductions in anthropogenic emissions CH4 O3 OH METHANE OZONE O3 NOX CH4 forcing estimated using Ramaswamy et al. (2001), O3 forcing using GFDL AM2 radiative transfer model.
Radiative Forcing and Ozone Air QualityEffects of 20% reductions in anthropogenic emissions Radiative Forcing Ozone air quality METHANE OZONE ∆O3srf global population- weighted 8hr. 3-month Reducing methane emissions causes the greatest reduction in RF per unit improvement in O3 air quality. ∆ RFnet / ∆ O3srf West et al. (2007) GRL
Human Health Effects of Ozone and PM • Time-series studies: relate short-term (day-to-day) changes in concentration to daily mortality rates • Cohort studies: relate community-level exposures over multiple years to annual mortality • Relative Risk (RR) = the ratio of the probability of health outcome in exposed group vs. unexposed group Mortality effects of PM in long-term cohort studies: Mortality effects of ozone in short-term time-series studies: Bell et al., 2004 Pope et al., 2002
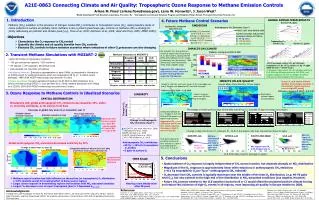
Mitigating Global Ozone Pollution by Reducing Methane Emissions: Global Health Benefits Change in surface ozone from a 20% reduction in global anthropogenic methane emissions. • Motivation • Methane, the most abundant VOC, contributes to the growing global background of tropospheric ozone. • Methane mitigation has been considered for climate, but not for air quality. • GOAL: Consider the viability of methane control for managing tropospheric ozone, by considering the costs of control and benefits for avoided human mortality. • Methane mitigation decreases O3 everywhere (using MOZART-2, steady-state relative to 2030 A2). • ∆O3 = -1.16 ppbv (glob. Ann. Avg. 8-hr. O3, population-weighted).
Mitigating Global Ozone Pollution by Reducing Methane Emissions: Global Health Benefits Standard Local Ozone concentration Regional Background Historical Future • Conclusions • Methane emission reductions decrease ozone everywhere, while also reducing greenhouse warming. • Monetized health benefits are ~$240 per ton CH4 ($12 per ton CO2 eq.) - which can justify the 20% methane reduction. • Methane abatement can be a cost-effective component of international long-term ozone management. Global avoided premature mortalities from a 20% reduction in global anthropogenic methane emissions. Continued domestic emission controls Opportunity for global methane controls Prevents ~30,000 premature mortalities in 2030 (~0.04% of total deaths), and ~370,000 from 2010-2030. West et al. (2006) PNAS
Ozone Precursors Affect Both Ozone Air Quality and Climate Forcing Global Urban hn hn O3 O3 NO NO NO2 NO2 HO2 HO2 OH OH NMVOCs, CO, CH4 NMVOCs, CO
Is ozone exported or NOx? Source Region
Ozone changesEffects of 20% reductions in anthropogenic emissions CH4 O3 OH Tropospheric O3 burden ∆O3srf annual average Short term Steady state ∆O3srf global population-weighted 8hr. 3-month O3 NOX
Effect of 10% regional NOx reductionsat steady state Receptor Region Source Region Change in 3-month population-weighted average O3 (ppt)