Download
1 / 10
100 likes | 266 Views
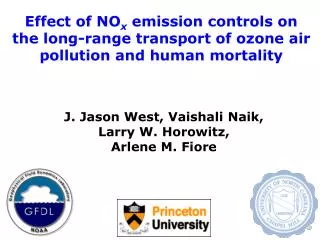
ORIGIN OF BACKGROUND OZONE IN SURFACE AIR OVER THE UNITED STATES: CONTRIBUTION TO POLLUTION EPISODES. Daniel J. Jacob and Arlene M. Fiore Atmospheric Chemistry Modeling Group Harvard University. THE PROBLEM.

E N D
ORIGIN OF BACKGROUND OZONEIN SURFACE AIR OVER THE UNITED STATES:CONTRIBUTION TO POLLUTION EPISODES Daniel J. Jacob and Arlene M. Fiore Atmospheric Chemistry Modeling Group Harvard University
THE PROBLEM • Ozone in surface air over the U.S. in summer includes a 20-50 ppbv background transported from outside the continental boundary layer • Evidence from O3 vs. (NOy-NOx) correlations, frequency distributions, measurements at clean sites, models. • Nineteenth-century observations (Europe) indicate 5-10 ppbv O3, preindustrial models calculate 10-20 ppbv O3. • What is the origin of the present-day background, and how does it contribute to pollution episodes?
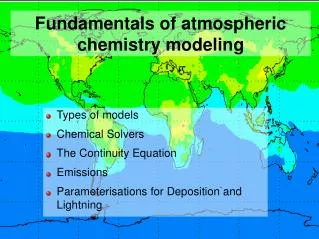
GEOS-CHEM GLOBAL 3-D MODEL OF TROPOSPHERIC CHEMISTRY: APPLICATION TO SUMMER 1995 SIMULATION OF REGIONAL O3 POLLUTION IN THE U.S.AIRS, SOS, NARSTO-NE observations • Assimilated meteorological observations from NASA DAO • 2ox2.5o horizontal resolution, 26 vertical layers • 120 chemical species to describe tropospheric O3-NOx-hydrocarbon chemistry; aerosol effects on chemistry, radiation • SAMI July 1995 emission inventory for eastern U.S.
SUMMER 1995 AFTERNOON OZONEIN SURFACE AIR OVER THE U.S. AIRS observations GEOS-CHEM (r2 = 0.4, bias=3 ppbv)
FREQUENCY DISTRIBUTION OF SURFACE p.m. O3IN WESTERN MASSACHUSETTS IN SUMMER 1995 Model (crosses) Air quality standard Observations (squares, triangles)
MEAN AFTERNOON OZONE BACKGROUNDIN MODEL, SUMMER 1995 Background is tagged as ozone produced outside the N. American boundary layer (surface-700 hPa)
DEPLETION OF OZONE BACKGROUNDDURING POLLUTION EPISODES(due to regional stagnation, short O3 lifetime) O3 vs. (NOy-NOx) At Harvard Forest, Massachusetts Background (clean conditions) Background (pollution episodes)
FREQUENCY DISTRIBUTION OF AFTERNOON BACKGROUND OZONE CONCENTRATIONSIN U.S. SURFACE AIR IN SUMMER 1995 (model)summer ensemble vs. pollution episodes Convection upwind occasionally results in high background during pollution episodes
ASIAN/EUROPEAN POLLUTION ENHANCEMENTOF BACKGROUND OZONE IN U.S.Mean model values, summer 1995 (4ox5o resolution) “Natural” background (no anthropogenic emissions of NOx or NMHCs anywhere, but present-day CH4) Asian/European anthropogenic enhancement above natural background (no anthropogenic emissions in North America)
RANGE OF ASIAN/EUROPEAN POLLUTION OZONE ENHANCEMENTS OVER THE UNITED STATES ensemble of model results, summer 1995 Max enhancements (up to 14 ppbv) under moderately polluted conditions (50-70 ppbv O3) MAJOR CONCERN IF OZONE STANDARD WERE TO DECREASE TO 60 PPBV!