Download
1 / 41
410 likes | 421 Views
This article provides an overview of nonparametric thresholding methods for family-wise error inference using SnPM. It discusses the multiple comparisons problem and introduces permutation tests to find thresholds and control the chance of false positives.

E N D
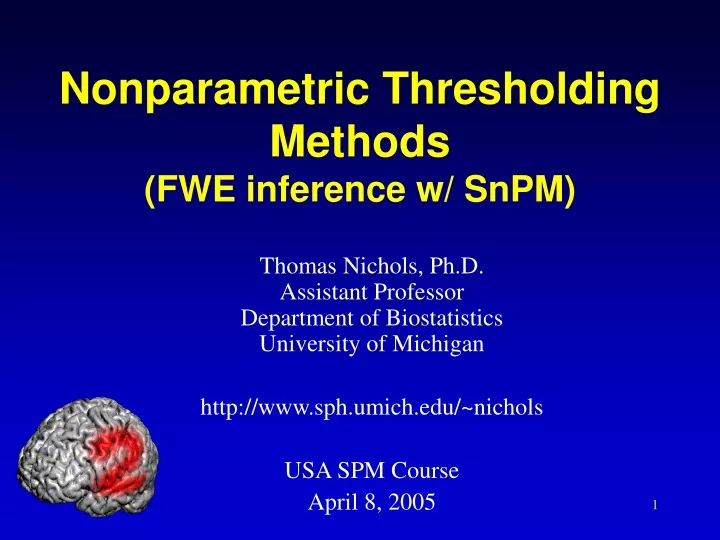
Nonparametric Thresholding Methods(FWE inference w/ SnPM) Thomas Nichols, Ph.D. Assistant Professor Department of Biostatistics University of Michigan http://www.sph.umich.edu/~nichols USA SPM Course April 8, 2005
Overview • Multiple Comparisons Problem • Which of my 100,000 voxels are “active”? • SnPM • Permutation test to find threshold • Control chance of any false positives (FWER)
5% Parametric Null Distribution 5% Nonparametric Null Distribution Nonparametric Inference • Parametric methods • Assume distribution ofstatistic under nullhypothesis • Needed to find P-values, u • Nonparametric methods • Use data to find distribution of statisticunder null hypothesis • Any statistic!
Permutation TestToy Example • Data from V1 voxel in visual stim. experiment A: Active, flashing checkerboard B: Baseline, fixation 6 blocks, ABABAB Just consider block averages... • Null hypothesis Ho • No experimental effect, A & B labels arbitrary • Statistic • Mean difference
Permutation TestToy Example • Under Ho • Consider all equivalent relabelings
Permutation TestToy Example • Under Ho • Consider all equivalent relabelings • Compute all possible statistic values
Permutation TestToy Example • Under Ho • Consider all equivalent relabelings • Compute all possible statistic values • Find 95%ile of permutation distribution
Permutation TestToy Example • Under Ho • Consider all equivalent relabelings • Compute all possible statistic values • Find 95%ile of permutation distribution
Permutation TestToy Example • Under Ho • Consider all equivalent relabelings • Compute all possible statistic values • Find 95%ile of permutation distribution -8 -4 0 4 8
Permutation TestStrengths • Requires only assumption of exchangeability • Under Ho, distribution unperturbed by permutation • Allows us to build permutation distribution • Subjects are exchangeable • Under Ho, each subject’s A/B labels can be flipped • fMRI scans not exchangeable under Ho • Due to temporal autocorrelation
Permutation TestLimitations • Computational Intensity • Analysis repeated for each relabeling • Not so bad on modern hardware • No analysis discussed below took more than 3 hours • Implementation Generality • Each experimental design type needs unique code to generate permutations • Not so bad for population inference with t-tests
MCP Solutions:Measuring False Positives • Familywise Error Rate (FWER) • Familywise Error • Existence of one or more false positives • FWER is probability of familywise error • False Discovery Rate (FDR) • R voxels declared active, V falsely so • Observed false discovery rate: V/R • FDR = E(V/R)
FWER MCP Solutions • Bonferroni • Maximum Distribution Methods • Random Field Theory • Permutation
FWER MCP Solutions: Controlling FWER w/ Max • FWER & distribution of maximum FWER = P(FWE) = P(One or more voxels u | Ho) = P(Max voxel u | Ho) • 100(1-)%ile of max distn controls FWER FWER = P(Max voxel u | Ho) u
FWER MCP Solutions • Bonferroni • Maximum Distribution Methods • Random Field Theory • Permutation
5% Parametric Null Max Distribution 5% Nonparametric Null Max Distribution Controlling FWER: Permutation Test • Parametric methods • Assume distribution ofmax statistic under nullhypothesis • Nonparametric methods • Use data to find distribution of max statisticunder null hypothesis • Again, any max statistic!
Permutation TestOther Statistics • Collect max distribution • To find threshold that controls FWER • Consider smoothed variance t statistic • To regularize low-df variance estimate
mean difference Permutation TestSmoothed Variance t • Collect max distribution • To find threshold that controls FWER • Consider smoothed variance t statistic t-statistic variance
Permutation TestSmoothed Variance t • Collect max distribution • To find threshold that controls FWER • Consider smoothed variance t statistic SmoothedVariancet-statistic mean difference smoothedvariance
Active ... ... yes Baseline ... ... D UBKDA N XXXXX no Permutation TestExample • fMRI Study of Working Memory • 12 subjects, block design Marshuetz et al (2000) • Item Recognition • Active:View five letters, 2s pause, view probe letter, respond • Baseline: View XXXXX, 2s pause, view Y or N, respond • Second Level RFX • Difference image, A-B constructedfor each subject • One sample, smoothed variance t test
Maximum Intensity Projection Thresholded t Permutation DistributionMaximum t Permutation TestExample • Permute! • 212 = 4,096 ways to flip 12 A/B labels • For each, note maximum of t image .
Permutation TestExample • Compare with Bonferroni • = 0.05/110,776 • Compare with parametric RFT • 110,776 222mm voxels • 5.15.86.9mm FWHM smoothness • 462.9 RESELs
378 sig. vox. Smoothed Variance t Statistic,Nonparametric Threshold Test Level vs. t11 Threshold uRF = 9.87uBonf = 9.805 sig. vox. uPerm = 7.67 58 sig. vox. t11Statistic, Nonparametric Threshold t11Statistic, RF & Bonf. Threshold
Conclusions • t random field results conservative for • Low df & smoothness • 9 df & 12 voxel FWHM; 19 df & < 10 voxel FWHM(based on Monte Carlo simulations, not shown) • Bonferroni not so bad for low smoothness • Nonparametric methods perform well overall
Monte Carlo Evaluations • What’s going wrong? • Normality assumptions? • Smoothness assumptions? • Use Monte Carlo Simulations • Normality strictly true • Compare over range of smoothness, df • Previous work • Gaussian (Z) image results well-validated • t image results hardly validated at all!
Monte Carlo EvaluationsChallenges • Accurately simulating t images • Cannot directly simulate smooth t images • Need to simulate smooth Gaussian images ( = degrees of freedom) • Accounting for all sources of variability • Most M.C. evaluations use known smoothness • Smoothness not known • We estimated it residual images
Autocorrelation Function Monte Carlo Evaluations • Simulated One Sample T test • 32x32x32 Images (32767 voxels) • Smoothness: 0, 1.5, 3, 6,12 FWHM • Degrees of Freedom: 9, 19, 29 • Realizations: 3000 • Permutation • 100 relabelings • Threshold: 95%ile of permutation distn of maximum • Random Field • Threshold: { u : E(u| Ho) = 0.05 } • Also Gaussian FWHM
Inf. df FamilywiseErrorThresholds • RFT valid but conservative • Gaussian not so bad (FWHM >3) • t29 somewhat worse 29df more
Inf df FamilywiseRejectionRates • Need > 6 voxel FWHM 29 df more
19 df FamilywiseErrorThresholds • RF & Perm adapt to smoothness • Perm & Truth close • Bonferroni close to truth for low smoothness 9 df more
19 df FamilywiseRejectionRates • Bonf good on low df, smoothness • Bonf bad for high smoothness • RF only good for high df, high smoothness • Perm exact 9 df more
19 df FamilywiseRejectionRates • Smoothness estimation is not (sole) problem 9 df cont
Performance Summary • Bonferroni • Not adaptive to smoothness • Not so conservative for low smoothness • Random Field • Adaptive • Conservative for low smoothness & df • Permutation • Adaptive (Exact)
Understanding Performance Differences • RFT Troubles • Multivariate Normality assumption • True by simulation • Smoothness estimation • Not much impact • Smoothness • You need lots, more at low df • High threshold assumption • Doesn’t improve for 0 less than 0.05 (not shown) HighThr
Conclusions • t random field results conservative for • Low df & smoothness • 9 df & 12 voxel FWHM; 19 df & < 10 voxel FWHM • Bonferroni surprisingly satisfactory for low smoothness • Nonparametric methods perform well overall • More data and simulations needed • Need guidelines as to when RF is useful • Better understand what assumption/approximation fails
References • TE Nichols and AP Holmes.Nonparametric Permutation Tests for Functional Neuroimaging: A Primer with Examples. Human Brain Mapping, 15:1-25, 2002. • http://www.sph.umich.edu/~nichols Data ThrRslt MC ThrRslt MC P Rslt EstSmCf
Permutation TestExample • Permute! • 212 = 4,096 ways to flip A/B labels • For each, note max of smoothed variance t image . Permutation DistributionMax Smoothed Variance t Maximum Intensity Projection Threshold Sm. Var. t