Download

1 / 32
320 likes | 472 Views
Midcourse Assessment of Healthy People 2010 Goal II. Suzanne P. Hallquist, MSPH Kenneth G. Keppel, PhD National Center for Health Statistics Centers for Disease Control and Prevention NCHS Data Users Conference July 12, 2006. Healthy People 2010 Goal II.

E N D
Midcourse Assessment of Healthy People 2010 Goal II Suzanne P. Hallquist, MSPH Kenneth G. Keppel, PhD National Center for Health Statistics Centers for Disease Control and Prevention NCHS Data Users Conference July 12, 2006
Healthy People 2010 Goal II “… to eliminate health disparities among segments of the population, including differences that occur by gender, race or ethnicity, education or income, disability, geographic location, or sexual orientation.” • - Healthy People 2010: Understanding and Improving Health, • U.S. Department of Health and Human Services, 2000.
Population Data Template Race and ethnicity Education level American Indian/ Alaska Native Asian/Pacific Islander Asian Native Hawaiian/ other Pacific Islander Two or more races Hispanic or Latino Black not Hispanic White not Hispanic Less than high school High school graduate At least some college Family income level Poor Near poor Middle/high income Geographic location* Urban/metropolitan Rural/non-metropolitan Gender Female Male Disability status* Persons with disabilities Persons without disabilities * Optional
Measuring Health Disparities:Key Issues • Choice of reference point • Another group rate • Average population rate • Total population rate • 2010 target • “Best” group • Absolute vs.relative statistics
Purpose of Assessment • Assess the availability of data for population groups and characteristics • Quantify the size of disparities at the most recent data point • Quantify the size and direction of changes in disparity between the baseline and the most recent data point • Summarize findings by population group and characteristic
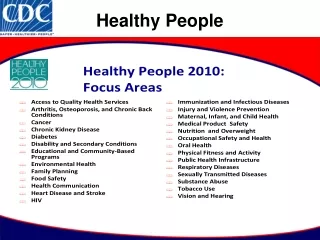
Scope of Assessment • 27 of 28 focus areas • 498 population-based objectives • Five characteristics: • Race/ethnicity • Gender • Education or income level • Geographic location • Disability
Data Availability Race and ethnicity (498): Education level (244): American Indian/ Alaska Native Asian/Pacific Islander Asian Native Hawaiian/ other Pacific Islander Two or more races Hispanic or Latino Black not Hispanic White not Hispanic Less than high school High school graduate At least some college Family income level (285): Poor Near poor Middle/high income Geographic location* (68): Urban/metropolitan Rural/non-metropolitan Gender (412): Female Male Disability status* (183): Persons with disabilities Persons without disabilities * Optional
Percent Difference Measures disparity between two groups Ri - RB x 100 RB RB is the “best” group rate Ri is the comparison group rate
Decoding the Disparity Table • “B” identifies the “best” group • Colors indicate the size of the disparity between the individual group and the “best” group rate at the most recent data point: Percent difference: Less than 10% or not statistically significant 10-49% 50-99% 100% or more
Decoding the Disparity Table • Arrows indicate the size and direction of the change in disparity between the baseline and MR data points DisparityIncreasing DisparityDecreasing Magnitude of Change inPercentage Points < 10 or not statistically significant 10-49 50-99 100
Summary Index Measures disparity among several groups • ∑i PDi • n – 1 PDi is the percent difference from the “best” group rate for each comparison group rate (i) n-1 is the number of groups minus 1
Race and Ethnicity Percent of objectives Percent difference from the “best” group rate: 100 80 60 40 20 0 or Alaska Native other Pacific Islander DRAFT
Education Level Percent of objectives Percent difference from the “best” group rate: DRAFT
Groups that have the “Best” Rate for the Greatest Proportion of Objectives DRAFT
Groups with the Greatest Proportion of Disparities that are > 100 Percent DRAFT
Number of Objectives with No Change* in Disparity by Population Characteristic DRAFT * Changes in disparity are measured from baseline to most recent data point.
Number of Objectives with Changes* in Disparityby Race and Ethnicity Increasing No Change Percentage points 10-49 10 50-99 3 More the 100 2 15 Decreasing 162 23 Percentage points 10-49 14 50-99 2 DRAFT More the 100 7 * Changes in disparity are measured from baseline to most recent data point.
Number of Objectives with Changes* in Disparityby Education Level Increasing No Change Percentage points 10-49 13 50-99 1 14 92 3 Decreasing Percentage points 10-49 3 DRAFT * Changes in disparity are measured from baseline to most recent data point.
Summary of Findings • Substantial disparities between population groups are evident for many objectives • Few changes in disparity since the baseline • Overall, no consistent pattern of change in disparity for any population group (except males)
Limitations • Short time period of analysis • Number of years available for assessment varied by population characteristic • Lack of data for: • - Specific characteristics • - Specific groups • Lack of estimates of variability for some objectives
Limitations • Disparity analysis focuses on differences between groups, regardless of whether or not the rates for specific groups are movingtowards or away from the target • Summary counts and charts, while helpful, mask the objective-specific successes and failures
New Cases of Hepatitis A, United States, 1997-2003 New cases per 100,000 population Hispanic American Indian/Alaska Native Black, not Hispanic White, not Hispanic Asian/Pacific Islander 2010 target (4.3) Objective 14-06 Source: STD Surveillance System, NCHSTP,CDC
Conclusions • Healthy People 2010 has developed a consistent framework for measuring disparities • Healthy People 2010 Midcourse Review • First comprehensive assessment of disparity for Healthy People • Document to be published in Fall 2006
Contact Information Suzanne Proctor Hallquist CDC/National Center for Health Statistics 3311 Toledo Road, Room 6315 Hyattsville, MD 20782 sop9@cdc.gov