Download
1 / 6
60 likes | 179 Views
Diversity Committee. Teaching Ethnicity & Identity through Literature. How can Diversity be taught?. How do students see themselves? How do students see others? First day – What do students think about ENG 102?. “The Lesson” A short story by Toni Cade Bambara. Reaching self-understanding

E N D
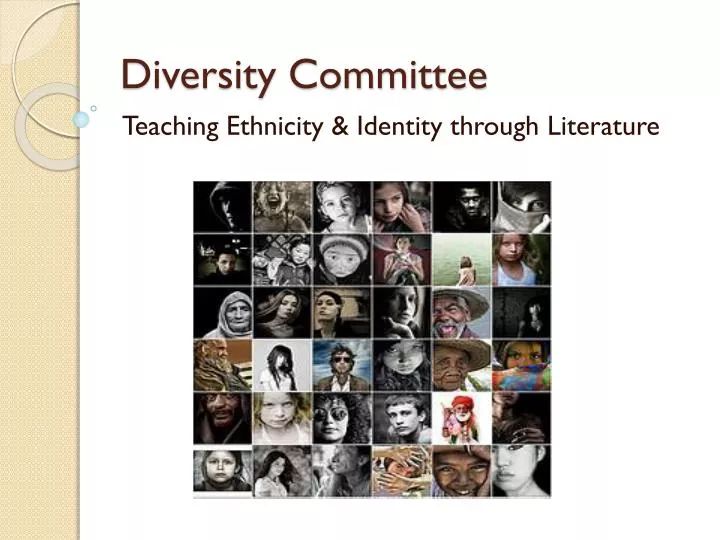
Diversity Committee Teaching Ethnicity & Identity through Literature
How can Diversity be taught? • How do students see themselves? • How do students see others? • First day – What do students think about ENG 102?
“The Lesson” A short story by Toni Cade Bambara • Reaching self-understanding • Understanding others • Creating Community
Diversity through Content Courses • Humanities • Social Sciences • Math • Science • Technology
DemographicsLowell • Lowell is an ethnically diverse city, with 62.5% of the population being White, 16.5% Asian, 14% Latino, 4.2% Black, and 2.5% other ethnicities. Lowell has the second largest Cambodian population in the United States. Last year, my Composition II class was comprised of 50% non-white ethnic students and 50% white students. • The median household income in the city was $39,192 and $45,901 for a family. Males had a median income of $33,554 and females $27,399. The per capita income for the city is $17,557 http://www.lowell.com/demographics.php
DemographicsBedford • As of the census[5] of 2000, there were 12,595 people, 4,621 households, and 3,419 families residing in the town. • The racial makeup of the town was 91.19% White, 1.65% African American, 0.22% Native American, 5.40% Asian, 0.34% from other races, and 1.19% from two or more races. Hispanic or Latino of any race were 1.80% of the population. http://factfinder.census.gov/home/saff/main.html?_lang=en • Census facts Median family income is $101,081, compared to a national rate of $50,046, and 57 percent of residents held a bachelor's degree or higher, compared to a national rate of 24 percent. http://www.boston.com/realestate/articles/2005/08/07/bedford/