Download
1 / 19
200 likes | 314 Views
The Global Ocean Carbon Cycle Rik Wanninkhof, NOAA/AOML. Annual OCO review, June 2007: Celebrating Our Past, Observing our Present, Predicting our Future: Ocean Observations as a Key to Global Understanding. NOAA highlights 200 years of science, service, and stewardship.

E N D
The Global Ocean Carbon CycleRik Wanninkhof, NOAA/AOML Annual OCO review, June 2007: Celebrating Our Past, Observing our Present, Predicting our Future: Ocean Observations as a Key to Global Understanding.
NOAA highlights 200 years of science, service, and stewardship. The NOAA Carbon groups highlight: 180 years of greenhouse gas research “Jean Baptiste Fourier is credited with the discovery in his essay in 1827 that gases in the atmosphere might increase the surface temperature of the Earth” Wikipedia
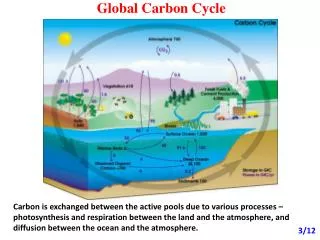
The Overriding questions: 8 Pg C/yr released to the atmosphere ≈ 4 ppm increase 4 Pg C/yr remains ≈ 2 ppm Where does the remaining C go to? How does this change with time? What causes the changes? What are the ecosystem impacts?
CO2 Research Breakthroughs and New Questions Arising from OCO Sponsored Observations Three major programs: Global Ocean CO2 inventories Air-Sea CO2 fluxes from ships and moorings Data Management, Analysis and Synthesis (Coastal Carbon Research)
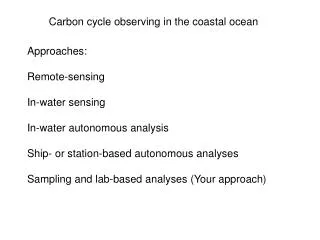
1. Global Ocean CO2 Inventories CLIVAR/CO2 Repeat Hydrography Sponsors: NOAA/OCO, NSF/OCO Participants: (NOAA funded) PMEL/AOML & CI’s Measurements: CO2, hydro, nutrients, O2, CFC, SF6 I8S/I9N January/April, 2007
Determine the Decadal Uptake of Anthropogenic CO2 Uncertainty: < 4 Pg/C/decade (out of an estimated 20 Pg C) Approach: Differencing with previous inventory estimates Findings: Atlantic Pacific 25 ˚W 152 ˚W (mol m-2 yr-1) Northern Hemisphere 0.75 0.25 Southern Hemisphere 0.63 0.41 [Global estimate : 0.5 mol/m2/yr ] But:∆ = Canthro + ∆CNatural + ∆CClimate ≠ 0≠ 0 Ocean biogeochemistry not in steady state on decadal timescales Research question: How to determine anthropogenic CO2? Eastern Pacific 153 ˚W Sabine et al. BAMS, 2007
I8S-I9N Re-occupation Courtesy J. Bullister, PMEL
Research/observational needs- Inventories • Need better estimates of changes in productivity and respiration • - Need better estimates of ventilation and mixing - Use of transient tracers, such as SF6 Bullister and Sonnerup, 2007
2. Surface water CO2 (Moorings andship of opportunity) Objective: Constrain regional air-sea CO2 fluxes to 0.2 Pg C year Findings: Global climatology estimate 30 % less than previous (Attributed to increased data and improved procedures, not global change) Interannual variability ≈ 10 %
Updated Air-Sea CO2 Flux Climatology Takahashi et al. 2007 Uptake = 1.2 Pg C year
Research question: Are there (positive) feedbacks? 1. North Atlantic observations suggest decreasing uptake 2. Models suggest a positive feedback in SO- Increasing winds- increasing upwelling-increasing pCO2w Le Quere et al. Science May, 2007
Started 2002, operational 2005 onwards Collaborations in the North Atlantic and North Pacific Courtesy D. Bakker CarboOcean
3. Data Management, Analysis and Synthesis • Production of flux maps [ F = k s ∆pCO2] • North Atlantic and North Pacific synthesis • LAS server for pCO2 data • - Takahashi climatology • - Takahashi database • - Original data
4. Coastal CO2: What are the magnitudes and what causes the variations in CO2 fluxes in coastal region? State Of the Carbon Cycle Report (SOCCR): Northern Regions: Sink ≈ 0.2 Pg C Southern regions Source ≈ 0.2 Pg C
Coastal Survey Cruises First Synoptic Measurements of CO2 along the coasts
Determination of Seasonal Cycles of pCO2 in Coastal Regions Excursions in pCO2 in coastal ocean >> open ocean Jiang et al., In Preparation
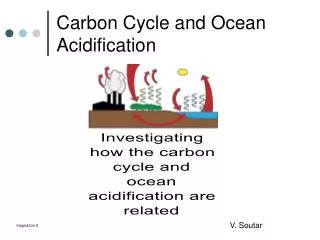
Coastal (upwelling) regions sensitive to ocean acidification When pCO2 levels in seawater approach 1000 µatm dissolution of calcium carbonate (aragonite) will occur. Coastal upwelling regions such as the Peru upwelling system, the Arabian Sea, West Coast of US, and near bathymetric features in the US experience such levels in the surface water and could serve as test beds for ocean acidification research.
And now to deflect the first question: The New Yorker May 28, 2007