Download
1 / 18
180 likes | 298 Views
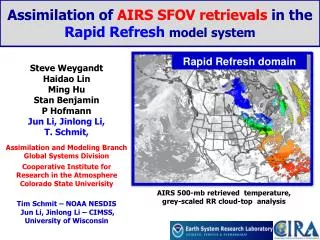
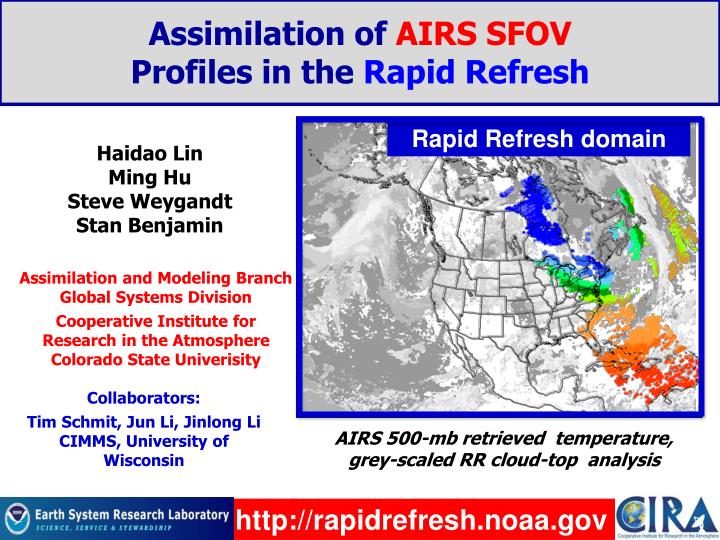
Assimilation of AIRS SFOV Profiles in the Rapid Refresh. Rapid Refresh domain. Haidao Lin Ming Hu Steve Weygandt Stan Benjamin. Assimilation and Modeling Branch Global Systems Division Cooperative Institute for Research in the Atmosphere Colorado State Univerisity. Collaborators:

E N D
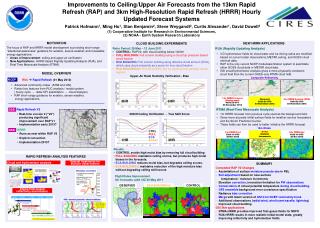
Assimilation of AIRS SFOV Profiles in the Rapid Refresh Rapid Refresh domain Haidao Lin Ming Hu Steve Weygandt Stan Benjamin Assimilation and Modeling Branch Global Systems Division Cooperative Institute for Research in the Atmosphere Colorado State Univerisity Collaborators: Tim Schmit, Jun Li, Jinlong Li CIMMS, University of Wisconsin AIRS 500-mb retrieved temperature, grey-scaled RR cloud-top analysis http://rapidrefresh.noaa.gov
Presentation Outline • Backgroundon Rapid Refresh system • Retrospective experiment design and data impact benchmarking • AIRS SFOV data coverage and assessment • Initial AIRS SFOV data assimilation experiment • Impact of different assimilation settings • Test with new improved SFOV retrievals • Ongoing work and future plans
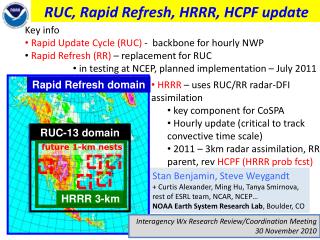
1. Background on Rapid Refresh RUC Rapid Refresh transition • Advancedcommunity codes (ARW and GSI) • Retain key features from RUC analysis / model system • (hourly cycle, cloud analysis, radar DFI assimilation) • Domain expansion consistent fields • over all of N. America for aviation / other • hazards (convection, icing, turbulence, • ceiling, visibility, etc.) • Status /implementation • Two real-time cycles running at GSD • Frozen test version running at EMC • NCEP operational implementation planned for 4Q 2011 (Aug./Sept.) Rapid Refresh13 RUC-13
Rapid Refresh Hourly Update Cycle Partial cycle atmospheric fields – introduce GFS information 2x per day Fully cycle all LSM fields Data types – counts/hr Rawinsonde (12h) 150 NOAA profilers 35 VAD winds ~130 PBL profilers / RASS ~25 Aircraft (V,T) 3500 – 10,000 TAMDAR 200 – 3000 METAR surface 2000 -2500 Mesonet (T,Td) ~8000 Mesonet (V) ~4000 Buoy / ship 200-400 GOES cloud winds 4000-8000 METAR cloud/vis/wx ~1800 GOES cloud-top P,T 10 km res. satellite radiance ~5,000 Radar reflectivity 1 km res. 1-hr fcst 1-hr fcst 1-hr fcst Back- ground Fields Analysis Fields 3DVAR 3DVAR Obs Obs Time (UTC) 11 12 13
2. Experiment Design / Benchmarking • 9 day retrospective period (May 8-16, 2010) • Initial tests with 3-h cycle, no partial cycling • Comparison of 3-h retro cycle with R/T RUC 3-h RR retro: -- worse than 1-h RR -- similar to R/T RUC 1-hourly R/T RUC 3-hourly RR retro 1-hourly RR retro (partial cycle) 12-h fcst wind RMS Error (100-1000 mb mean)
Evaluate Rawinsonde Denial Impact RAOB -- conventional obs (with raobs) + radiance (no AIRS) NO-RAOB -- conventional obs (no raobs) + radiance (no AIRS) (No AIRS SFOV for either) 12-h fcst wind RMS Error Mean diff 0.17 m/s NO- RAOB RAOB From Benjamin et al. MWR 2010 3-h 6-h 12-h Raob denial results closely match previous study
3. AIRS SFOV Data Assessment • Launched in May 2002 on NASA Earth Observing System (EOS) polar-orbiting Aqua platform • Twice daily, global coverage • 13.5 km horizontal resolution (Aumann et al. 2003) • 2378 spectral channels (3.7-15.4 µm) • Single Field of View (SFOV) soundings are derived using CIMSS physical retrieval algorithm (Li et al. 2000) • Clear sky only soundings
AIRS SFOV Data Coverage • 1.5-h time window (+/- 1.5 h) • 3-h cycle, data available on 06Z, 09Z,12Z,18Z, 21Z • Append available AIRS sounding data RR prebbufr observation files 06z 12z 09z 21z 18z
Compare AIRS SFOV with Raobs Temperature Temperature AIRS RAOB AIRS - RAOB Salem, Oregon 12z 8 May raob Nearby AIRS SFOV retrieval ( time / space gap: 1 h 21 min. / 6 km) Mixing Ratio AIRS RAOB Less vertical detail in SFOV Some T Differences > 3K
Compare AIRS SFOV with Raobs • 54 matched raob profiles during 0508—0516 period • Conditions for matched profiles : 3-h time window, less than 15 km horizontal distance under clear-sky Mixing Ratio bias Temp bias RH bias old obs new obs RH RMS Temp RMS Mixing Ratio RMS old obs new obs
4. Initial Assimilation Expt: T only • Use complete soundings -- 13.5-km horizontal resolution -- All available vertical levels (50-1000 mb) • Use supplied T error variance 200 400 600 800 1000 Temperature error variance CNTL FULL T 1.5 2 2.5 500 mb T Analysis Increments 0508 06Z Standard obs Std. obs + SFOV T Data coverage (500 mb temperature)
RMS Stats from SFOV T Assim. Expt. CNTL– std. observations No AIRS SFOV FULL T – std. obs + SFOV T – 50-1000 mb Time series of 6-h fcst T RMS error (100-1000 mb mean) Vertical profile of 6-h fcst T RMS error Time series of 12-h fcst T RMS error (100-1000 mb mean) Vertical profile of 12-h fcst T RMS error Similar negative impacts from SFOV T on forecast V, Q
5. Variations in SFOV Coverage (T only) Impact of reduced vertical coverage 200 400 600 800 1000 CNTL– std. observations - No AIRS SFOV FULL T – std. obs + SFOV T – 50-1000 mb PART T – std. obs + SFOV T – 100-800 mb MID T – std. obs + SFOV T – 400-800 mb Temperature error variance 1.5 2 2.5 6-h fcst T RMS Error 6-h fcst T RMS Error 6-h fcst V RMS Error 6-h fcst V RMS Error
Horizontal Thinning Analysis Difference (A-A) at 578 mb 0508 09Z 45 km No thinning 200 km 100 km 60 km
Vertical Thinning Analysis Difference (A-A) Analysis with AIRS – analysis without AIRS from single GSI runs on 20100508 09Z All AIRS data in 60 km No Vertical 25 mb 200 mb 50 mb 100 mb
Other Variations in SFOV Assim. (T only) Impact of assumed Obs error variance, data thinning CNTL– std. observations, No AIRS SFOV STD Err – standard temperature error variance, (400-800 mb) DBL Err – 2X standard temperature error variance (400-800 mb) THINNING – 60-km horiz., 50 mb vert., 2X std. error (400-800 mb) 6-h fcst T RMS Error 6-h fcst V RMS Error
Other Variations in SFOV Assim. (T only) 6. Tests with New Improved SFOV Raob comparison CNTL– std. observations, No AIRS SFOV OLD T Data-2X std. error, 60-km horiz, 50 mb vert., (400-800mb) New T Data – 60-km horiz, 50 mb vert., 2X std. error (400-800 mb) Temp RMS old obs new obs 6-h fcst T RMS Error 6-h fcst V RMS Error
7. Ongoing and Near Future Work • Complete basic assimilation experiments • -- temperature, moisture, combined • -- vertical extent, data thinning, observation error • 2. Use more selective data QC information • -- detailed QC mark from CIMSS (esp. vertical) • -- cloud edges, ocean only, night-time only • Possible bias correction (data analysis needed) • Possible use of 3x3 retrieval data • Evaluate sensitivity to retrieval vs. radiance data