Download
1 / 1
10 likes | 108 Views
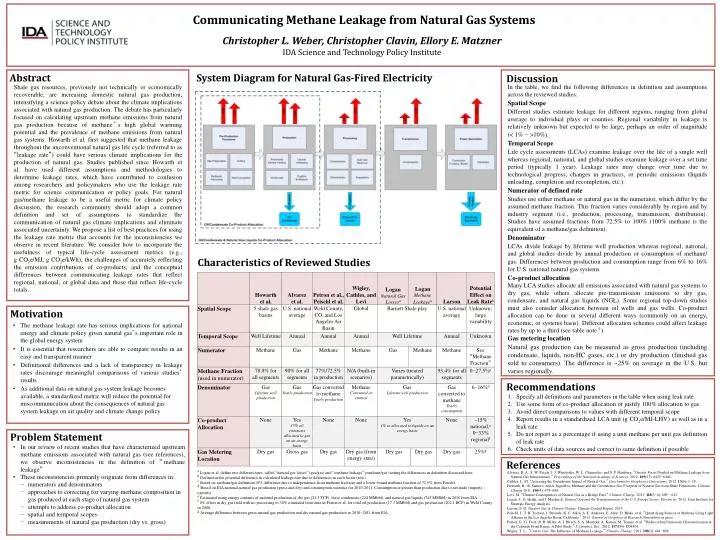
Communicating Methane Leakage from Natural Gas Systems. Christopher L. Weber, Christopher Clavin, Ellory E. Matzner IDA Science and Technology Policy Institute. Abstract. System Diagram for Natural Gas-Fired Electricity. Discussion.

E N D
Communicating Methane Leakage from Natural Gas Systems Christopher L. Weber, Christopher Clavin, Ellory E. Matzner IDA Science and Technology Policy Institute Abstract System Diagram for Natural Gas-Fired Electricity Discussion Shale gas resources, previously not technically or economically recoverable, are increasing domestic natural gas production, intensifying a science policy debate about the climate implications associated with natural gas production. The debate has particularly focused on calculating upstream methane emissions from natural gas production because of methane’s high global warming potential and the prevalence of methane emissions from natural gas systems. Howarthet al.first suggested that methane leakage throughout the unconventional natural gas life cycle (referred to as “leakage rate”) could have serious climate implications for the production of natural gas. Studies published since Howarth et al. have used different assumptions and methodologies to determine leakage rates, which have contributed to confusion among researchers and policymakers who use the leakage rate metric for science communication or policy goals. For natural gas/methane leakage to be a useful metric for climate policy discussion, the research community should adopt a common definition and set of assumptions to standardize the communication of natural gas climate implications and eliminate associated uncertainty. We propose a list of best practices for using the leakage rate metric that accounts for the inconsistencies we observe in recent literature. We consider how to incorporate the usefulness of typical life-cycle assessment metrics (e.g., g CO2e/MJ, g CO2e/kWh); the challenges of accurately reflecting the emission contributions of co-products; and the conceptual differences between communicating leakage rates that reflect regional, national, or global data and those that reflect life-cycle totals. In the table, we find the following differences in definition and assumptions across the reviewed studies: Spatial Scope Different studies estimate leakage for different regions, ranging from global average to individual plays or counties. Regional variability in leakage is relatively unknown but expected to be large, perhaps an order of magnitude (< 1% − >10%). Temporal Scope Life cycle assessments (LCAs) examine leakage over the life of a single well whereas regional, national, and global studies examine leakage over a set time period (typically 1 year). Leakage rates may change over time due to technological progress, changes in practices, or periodic emissions (liquids unloading, completion and recompletion, etc.). Numerator of defined rate Studies use either methane or natural gas in the numerator, which differ by the assumed methane fraction. This fraction varies considerably by region and by industry segment (i.e., production, processing, transmission, distribution). Studies have assumed fractions from 72.5% to 100% (100% methane is the equivalent of a methane/gas definition). Denominator LCAs divide leakage by lifetime well production whereas regional, national, and global studies divide by annual production or consumption of methane/ gas. Differences between production and consumption range from 6% to 16% for U.S. national natural gas systems. Co-product allocation Many LCA studies allocate all emissions associated with natural gas systems to dry gas, while others allocate pre-transmission emissions to dry gas, condensate, and natural gas liquids (NGL). Some regional top-down studies must also consider allocation between oil wells and gas wells. Co-product allocation can be done in several different ways (commonly on an energy, economic, or systems basis). Different allocation schemes could affect leakage rates by up to a third (see table note f ). Gas metering location Natural gas production can be measured as gross production (including condensate, liquids, non-HC gases, etc.) or dry production (finished gas sold to consumers). The difference is ~25% on average in the U.S. but varies regionally. Characteristics of Reviewed Studies Motivation • The methane leakage rate has serious implications for national energy and climate policy given natural gas’s important role in the global energy system • It is essential that researchers are able to compare results in an easy and transparent manner • Definitional differences and a lack of transparency in leakage rates discourage meaningful comparisons of various studies’ results • As additional data on natural gas system leakage becomes available, a standardized metric will reduce the potential for miscommunication about the consequences of natural gas system leakageon air quality and climate change policy Recommendations Specify all definitions and parameters in the table when using leak rate Use some form of co-product allocation or justify 100% allocation to gas Avoid direct comparisons to values with different temporal scope Report results in a standardized LCA unit (g CO2e/MJ-LHV) as well as in a leak rate Do not report as a percentage if using a unit methane per unit gas definition of leak rate Check units of data sources and correct to same definition if possible Problem Statement • In our review of recent studies that have characterized upstream methane emissions associated with natural gas (see references), we observe inconsistencies in the definition of “methane leakage” • These inconsistencies primarily originate from differences in: • numerators and denominators • approaches to correcting for varying methane composition in gas produced at each stage of natural gas system • attempts to address co-product allocation • spatial and temporal scopes • measurements of natural gas production (dry vs. gross) References aLogan et al. define two different rates, called “natural gas losses” (gas/gas) and “methane leakage” (methane/gas) noting the differences in definition discussed here. b Defined as the potential difference in calculated leakage rate due to differences in each factor (row). c Based on methane/gas definition (0% difference due to independence from methane fraction) and a lower bound methane fraction of 72.5% from Peischl. d Based on EIA national natural gas production (gross and dry) and consumption statistics for 2010-2011. Consumption is greater than production due to net trade (imports – exports). e Estimated using energy contents of national production of dry gas (21.3 TCF), lease condensate (224 MMbbl), and natural gas liquids (745 MMbbl) in 2010 from EIA f 0% effect in dry gas field with no processing to 30% estimated from data in Petron et al. for total oil production (17.3 MMbbl) and gas production (202.1 BCF) in Weld County in 2008. g Average difference between gross natural gas production and dry natural gas production in 2010−2011 from EIA. Alvarez, R. A., S. W. Pacala, J. J. Winebrake, W. L. Chameides, and S. P. Hamburg. “Greater Focus Needed on Methane Leakage from Natural Gas Infrastructure.”Proceedings of the National Academy of Sciences, 2012. 109(17): 6435−6440. Cathles, L. M. “Assessing the Greenhouse Impact of Natural Gas.”Geochemistry Geophysics Geosystems, 2012. 13(6): 1−18. Howarth, R., R. Santoro, and A. Ingraffea, Methane and the Greenhouse-Gas Footprint of Natural Gas from Shale Formations.Climatic Change 2011. 106(4): 679−690. Levi, M. “Climate Consequences of Natural Gas as a Bridge Fuel.”Climatic Change, 2013. 118(3−4): 609 − 623. Logan, J., G. Heath, and J. Macknick, Natural Gas and the Transformation of the U.S. Energy Sector: Electricity. 2012, Joint Institute for Strategic Energy Analysis. Larson, E. D. Natural Gas & Climate Change. Climate Central Report, 2013. Peischl, J., T. B. Tyerson, J. Brioude, K. C. Aikin, A. E. Andrews, E. Atlas, D. Blake, et al. “Quantifying Sources of Methane Using Light Alkanes in the Los Angeles Basin, California.” 2013. Journal of Geophysical Research Atmosphere in press. Petron, G., G. Frost, B. R. Miller, A. I. Hirsch, S. A. Montzka, A. Karion, M. Trainer, et al. “Hydrocarbon Emissions Characterization in the Colorado Front Range: A Pilot Study.”J. Geophys. Res., 2012. 117(D4): D04304. Wigley, T. L., “Coal to Gas: The Influence of Methane Leakage.”Climatic Change, 2011. 108(3): 601−608.