Download
1 / 16

E N D
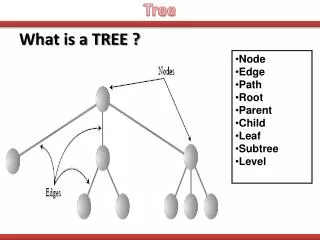
Tree Evaluation • A question often asked of a data set is whether it contains ‘significant cladistic structure’, that is whether we can have any confidence that the results of a cladistic analysis are, in some sense, ‘real’ and not just by-products of chance. The concept of cladistic structure can be studied from 2 viewpoints: • - Assign confidence to the best cladogram as a whole. • - Examine support afforded to individual clades within the best cladogram.
Confidence of Clades • Several methods have been proposed that attach numerical values to internal branches in trees that are intended to provide some measure of the strength of support for those branches and the corresponding groups. • These methods include: • - character resampling methods: • bootstrap and jackknife • - decay analyses
Bootstrapping • Bootstrapping (bootstrap analysis) is a modern statistical technique that uses computer intensive random resampling of data to determine sampling error or confidence intervals for some estimated parameter
Bootstrapping • Characters are resampled with replacement to create many bootstrap replicate data sets
Bootstrap – Resampling with Replacement a b c d e f g h i j 0 0 0 0 0 1 0 0 1 0 1 1 0 0 0 0 0 0 0 0 1 1 1 1 1 1 1 2 0 1 1 1 1 1 0 1 1 2 0 1 1 1 0 0 1 0 1 1 1 0 Taxon A Taxon B Taxon C Taxon D Taxon E Original data matrix New data matrices h f a b g a h c i h 0 1 0 0 0 0 0 0 1 0 0 0 1 1 0 1 0 0 0 0 2 1 1 1 1 1 2 1 0 2 2 1 1 1 1 1 2 1 0 2 1 0 1 1 1 1 1 0 1 1 g b c e f f b h a d 0 0 0 0 1 1 0 0 0 0 0 1 0 0 0 0 1 0 1 0 1 1 1 1 1 1 1 2 1 1 1 1 1 0 1 1 1 2 1 1 1 1 0 1 0 0 1 1 1 0 Taxon A Taxon B Taxon C Taxon D Taxon E Taxon A Taxon B Taxon C Taxon D Taxon E
Bootstrapping • Each bootstrap replicate data set is analysed (e.g. with MP, ML, distance). • Agreement among the resulting trees is summarized into a majority-rule consensus tree (usually 50% majority-rule). • Frequency of occurrence of groups (bootstrap support) is a measure of support for those groups. • Additional information is given in partition table.
Bootstrap value A B C D E 96% 55% 76%
Bootstrapping - an example Partition Table Ciliate SSUrDNA - parsimony bootstrap 123456789 Freq ----------------- .**...... 100.00 ...**.... 100.00 .....**.. 100.00 ...****.. 100.00 ...****** 95.50 .......** 84.33 ...****.* 11.83 ...*****. 3.83 .*******. 2.50 .**....*. 1.00 .**.....* 1.00 Ochromonas (1) Symbiodinium (2) 100 Prorocentrum (3) Euplotes (8) 84 Tetrahymena (9) 96 Loxodes (4) 100 Tracheloraphis (5) 100 Spirostomum (6) 100 Gruberia (7)
Bootstrap - Interpretation • High bootstrap support (BS) (e.g. > 75%) is indicative of strong ‘signal’ in the data. • Provided we have no evidence of strong misleading signal (e.g. base composition biases, great differences in branch lengths) high BS is likely to reflect strong phylogenetic signal. • Low BS needs not mean the relationship is false, only that it is poorly supported.
Jackknifing • Jackknifing is very similar to bootstrapping and differs only in the character resampling strategy. • Some proportion of characters are randomly selected and deleted. Therefore, the size of new data matrices is smaller than the original matrix. • Jackknife value is obtained by observing the number of characters being dropped to collapse a clade.
Jackknifing • If 2 out of 15 informative characters are dropped to collapse a clade, the jackknife value will be 2/15 = 0.13. • Therefore, the higher the jackknife value the higher the support for the clade. • Jackknifing and bootstrapping tend to produce broadly similar results and have similar interpretations.
Jackknife A B C D E 0.75 0.15 0.55
Decay analysis • In parsimony analysis, a way to assess support for a group is to see if the group also occurs in slightly less parsimonious trees. • The length difference between the shortest trees including the group and the shortest trees that exclude the group (the extra steps required to overturn a group) is the decay index or Bremer support. • Decay indices for each clade can be determined by saving increasingly less parsimonious trees and producing corresponding strict consensus trees until the consensus is completely unresolved.
Decay Values A B C D E 6 1 4
Decay indices - Interpretation • Generally, the higher the decay index the better the relative support for a group. • Decay indices are not scaled (0-100) and it is less clear what is an acceptable decay index. • Magnitude of decay indices and bootstrap/jackknife values generally correlated (i.e. they tend to agree). • Only groups found in all most parsimonious trees have decay indices > zero.