Download
1 / 1
10 likes | 121 Views
cDNA presence. Promoteur analysis. Proteomics. …. By gene name. Bioinformatics and Comparative Genomics – WP14. http://www-genoret.u-strasbg.fr/GenoretGenes. L. Poidevin, W. Raffelsberger, R. Reddy, G. Berthommier, N. Gagnière, R. Ripp and O. Poch

E N D
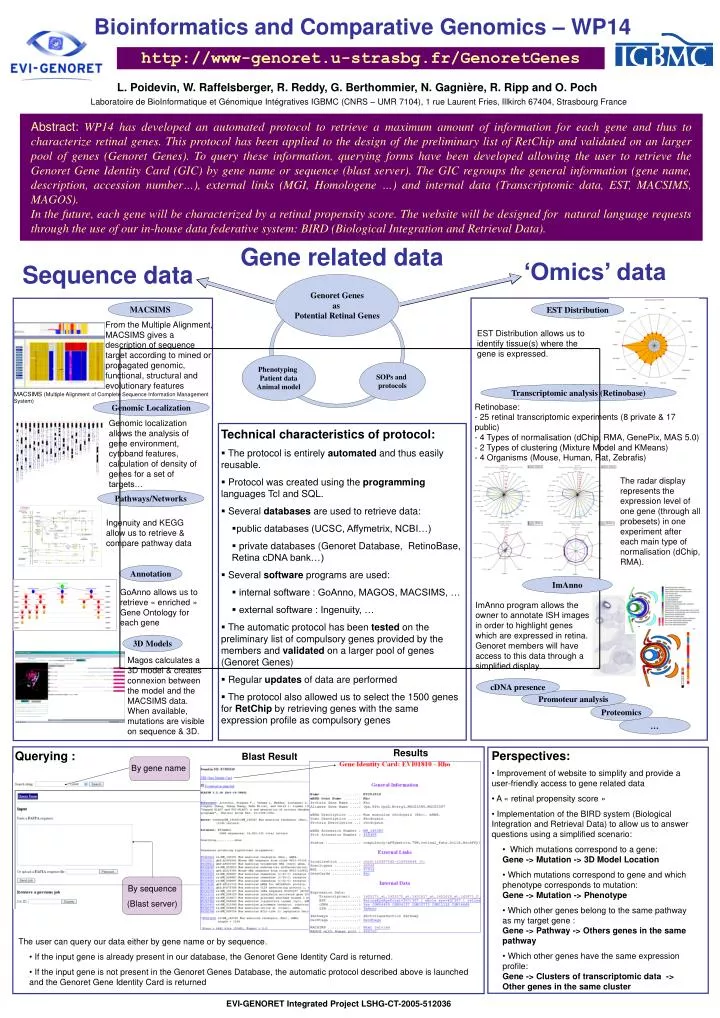
cDNA presence Promoteur analysis Proteomics … By gene name Bioinformatics and Comparative Genomics – WP14 http://www-genoret.u-strasbg.fr/GenoretGenes L. Poidevin, W. Raffelsberger, R. Reddy, G. Berthommier, N. Gagnière, R. Ripp and O. Poch Laboratoire de BioInformatique et Génomique Intégratives IGBMC (CNRS – UMR 7104), 1 rue Laurent Fries, Illkirch 67404, Strasbourg France Abstract: WP14 has developed an automated protocol to retrieve a maximum amount of information for each gene and thus to characterize retinal genes. This protocol has been applied to the design of the preliminary list of RetChip and validated on an larger pool of genes (Genoret Genes). To query these information, querying forms have been developed allowing the user to retrieve the Genoret Gene Identity Card (GIC) by gene name or sequence (blast server). The GIC regroups the general information (gene name, description, accession number…), external links (MGI, Homologene …) and internal data (Transcriptomic data, EST, MACSIMS, MAGOS). In the future, each gene will be characterized by a retinal propensity score. The website will be designed for natural language requests through the use of our in-house data federative system: BIRD (Biological Integration and Retrieval Data). Gene related data ‘Omics’ data Sequence data Genoret Genes as Potential Retinal Genes MACSIMS EST Distribution From the Multiple Alignment, MACSIMS gives a description of sequence target according to mined or propagated genomic, functional, structural and evolutionary features EST Distribution allows us to identify tissue(s) where the gene is expressed. Phenotyping Patient data Animal model SOPs and protocols Transcriptomic analysis (Retinobase) MACSIMS (Multiple Alignment of Complete Sequence Information Management System) Genomic Localization Retinobase: - 25 retinal transcriptomic experiments (8 private & 17 public) - 4 Types of normalisation (dChip, RMA, GenePix, MAS 5.0) - 2 Types of clustering (Mixture Model and KMeans) - 4 Organisms (Mouse, Human, Rat, Zebrafis) Genomic localization allows the analysis of gene environment, cytoband features, calculation of density of genes for a set of targets… • Technical characteristics of protocol: • The protocol is entirely automated and thus easily reusable. • Protocol was created using the programming languages Tcl and SQL. • Several databases are used to retrieve data: • public databases (UCSC, Affymetrix, NCBI…) • private databases (Genoret Database, RetinoBase, Retina cDNA bank…) • Several software programs are used: • internal software : GoAnno, MAGOS, MACSIMS, … • external software : Ingenuity, … • The automatic protocol has been tested on the preliminary list of compulsory genes provided by the members and validated on a larger pool of genes (Genoret Genes) • Regular updates of data are performed • The protocol also allowed us to select the 1500 genes for RetChip by retrieving genes with the same expression profile as compulsory genes The radar display represents the expression level of one gene (through all probesets) in one experiment after each main type of normalisation (dChip, RMA). Pathways/Networks Ingenuity and KEGG allow us to retrieve & compare pathway data Annotation ImAnno GoAnno allows us to retrieve « enriched » Gene Ontology for each gene ImAnno program allows the owner to annotate ISH images in order to highlight genes which are expressed in retina. Genoret members will have access to this data through a simplified display. 3D Models Magos calculates a 3D model & creates connexion between the model and the MACSIMS data. When available, mutations are visible on sequence & 3D. Results • Perspectives: • Improvement of website to simplify and provide a user-friendly access to gene related data • A « retinal propensity score » • Implementation of the BIRD system (Biological Integration and Retrieval Data) to allow us to answer questions using a simplified scenario: • Which mutations correspond to a gene: Gene -> Mutation -> 3D Model Location • Which mutations correspond to gene and which phenotype corresponds to mutation: Gene -> Mutation -> Phenotype • Which other genes belong to the same pathway as my target gene : Gene -> Pathway -> Others genes in the same pathway • Which other genes have the same expression profile: Gene -> Clusters of transcriptomic data -> Other genes in the same cluster Querying : Blast Result By sequence (Blast server) • The user can query our data either by gene name or by sequence. • If the input gene is already present in our database, the Genoret Gene Identity Card is returned. • If the input gene is not present in the Genoret Genes Database, the automatic protocol described above is launched and the Genoret Gene Identity Card is returned EVI-GENORET Integrated Project LSHG-CT-2005-512036