Download
1 / 57
570 likes | 641 Views
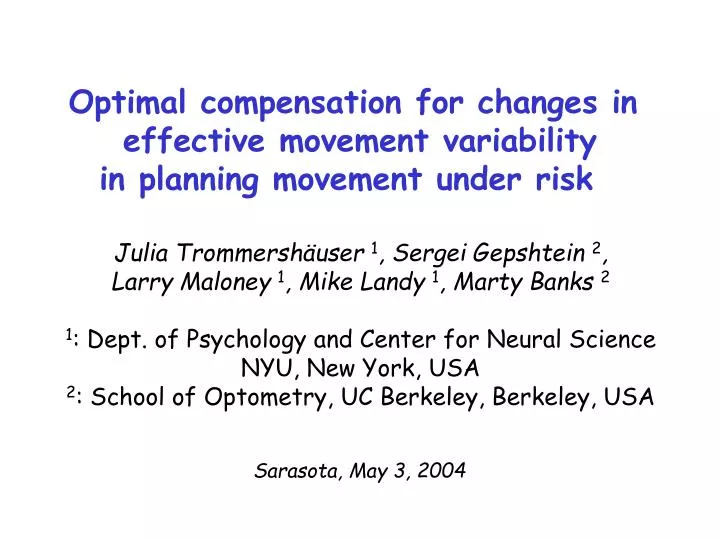
Optimal compensation for changes in effective movement variability in planning movement under risk. Julia Trommersh ä user 1 , Sergei Gepshtein 2 , Larry Maloney 1 , Mike Landy 1 , Marty Banks 2 1 : Dept. of Psychology and Center for Neural Science NYU, New York, USA

E N D
Optimal compensation for changes in effective movement variability in planning movement under risk Julia Trommershäuser 1, Sergei Gepshtein 2, Larry Maloney 1, Mike Landy 1, Marty Banks 2 1: Dept. of Psychology and Center for Neural Science NYU, New York, USA 2: School of Optometry, UC Berkeley, Berkeley, USA Sarasota, May 3, 2004
Motor responses have consequences. Trommershäuser, Maloney, Landy (2003). JOSA A, 20,1419. Trommershäuser, Maloney, Landy (2003). Spat. Vis., 16, 255.
Experimental Task Target display (700 ms) L
The green target is hit: +100 points 100 Experimental Task L 100
The red target is hit: -500 points -500 Experimental Task L -500
Scores add if both targets are hit: -500 100 Experimental Task L -500 100
Experimental Task The screen is hit later than 700 ms after target display: -700 points. You are too slow: -700
Experimental Task End of trial Current score: 500
Outline • Optimal Performance: • A Maximum Expected Gain Model • ofMovement under Risk (MEGaMove) • Human vs. Optimal Performance: • Compensation for Changes in • Effective Movement Variability • Conclusion
L Optimal visuo-motor strategy -500 The optimal mover chooses the motor strategy that maximizes the expected gain. 100 Trommershäuser, Maloney, Landy (2003). JOSA A, 20,1419. Trommershäuser, Maloney, Landy (2003). Spat. Vis., 16, 255.
20 10 0 -10 -20 -20 -10 0 10 20 Distribution of movement endpoints: Bivariate Gaussian, width : yhit-ymean (mm) = 3.62 mm, 72x15 = 1080 end points xhit-xmean (mm)
Optimal visuo-motor strategy optimal mean end point = 3.48 mm
Optimal visuo-motor strategy optimal mean end point = 3.48 mm
What if we change your movement variability?
Optimal visuo-motor strategy optimal mean end point optimal mean end point, increased noise = 3.48 mm = 6.19 mm
Optimal visuo-motor strategy • Parameters of the model: • reward structure of experiment: • experimenter-imposed • subject’s movement variability : • measured -500 100 = 3.23 mm = 4.17 mm
Optimal visuo-motor strategy • Parameters of the model: • reward structure of experiment: • experimenter-imposed • subject’s movement variability : • measured -500 100 All parameters estimated. Parameter-free predictions !
Outline • Optimal Performance: • A Maximum Expected Gain Model • ofMovement under Risk (MEGaMove) • Human vs. Optimal Performance: • Compensation for Changes in • Effective Movement Variability • Conclusion
Experiment Manipulation of effective movement variability: perturbation of visual feedback
Experiment Perturbation of visual feedback: increase in effective variability
Experiment Visually-imposed changes in effective movement variability. • Idea: • finger visually represented by red point • on each trial: unpredictable perturbation • of the visual feedback of the finger tip • Points are scored based on the perturbed • finger position
Experiment Visually-imposed changes in effective movement variability. Perturbation of the visual feedback of the finger tip by Medium increase in noise: High increase in noise:
Experiment Visually-imposed changes in effective movement variability. Experimental set-up:
varied between blocks Reward: 100 Penalties: 0 -200 -500 3 Penalties varied between sessions (retraining) Added noise 3 : 0 mm 4.5 mm 6 mm Design near middle 4 varied within blocks Configurations
Design • Six subjects • 1 practice session: 300 trials, • decreasing time limit • per noise condition: • 1 learning session: 300 trials • 2 sessions of data collection: 360 trials each • (40 repetitions per condition) • Payment: 1000 points = 25¢
Results Additivity of Variances
Optimal visuo-motor strategy optimal mean end point, no added noise optimal mean end point, = 3.48 mm = 6.19 mm
Results Scores: average subject data near middle
Results Scores: actual vs. optimal performance near middle middle, -200 near, -200 near, -500 middle, -500
Results Shift in end points: average subject data near middle
Results Shift in end points: actual vs. optimal shifts near middle middle, -200 near, -200 near, -500 middle, -500
Conclusions Movement planning takes extrinsic costs and the subject’s own motor uncertainty into account. Subjects combine visual and motor variability to compensate for changes in effective movement variability. Subjects do not differ significantly from ideal movement planners that maximize gain. Thank you!
Results Learning of “new” effective variability learning session actual finger position
Movement variability remains constant. Relative to stimulus size is larger for the small configuration. Experiment 2 Movement endpoints in response to changes in relative movement variability Stimulus configurations: small: large: 9 mm 6.3 mm
9 mm 6.3 mm 1 1 Experiment 2 Movement endpoints in response to changes in relative movement variability Stimulus configurations: small: large: /R /R larger relative variability smaller relative variability
R 2R Experiment 2 Movement endpoints in response to changes in relative movement variability 4 stimulus configurations in 2 sizes: small: R = 6.3 mm large: R = 9 mm (varied within blocks) 2 penalty conditions: 0 and -500 points (varied between blocks) 1 practice session: 300 trials, decreasing time limit 1 session: 16 warm-up trials, 6x2x32 trials
x/R = 1.1 x/R = 0.7 large, penalty = 0 large, penalty = 500 small, penalty = 0 small, penalty = 500 Experiment 2: Results Subject 1: = 3.16 mm x model
Experiment 2: Results (Data corrected for constant pointing bias)
Experiment 2: Results (Data corrected for constant pointing bias)
Experiment 2: Results (Data corrected for constant pointing bias)
Experiment 2: Results (Data corrected for constant pointing bias)
Experiment 2: Results (Data corrected for constant pointing bias)
Experiment 2: Results (Data corrected for constant pointing bias)