Download
1 / 35
350 likes | 353 Views
This article explores the value of family medicine training programs by examining the benefits and costs they bring to their institutions and communities. It discusses key financial concepts, program impact, and financial goals. Additionally, it delves into revenue sources, expenses, productivity, staffing models, and factors affecting program finances.

E N D
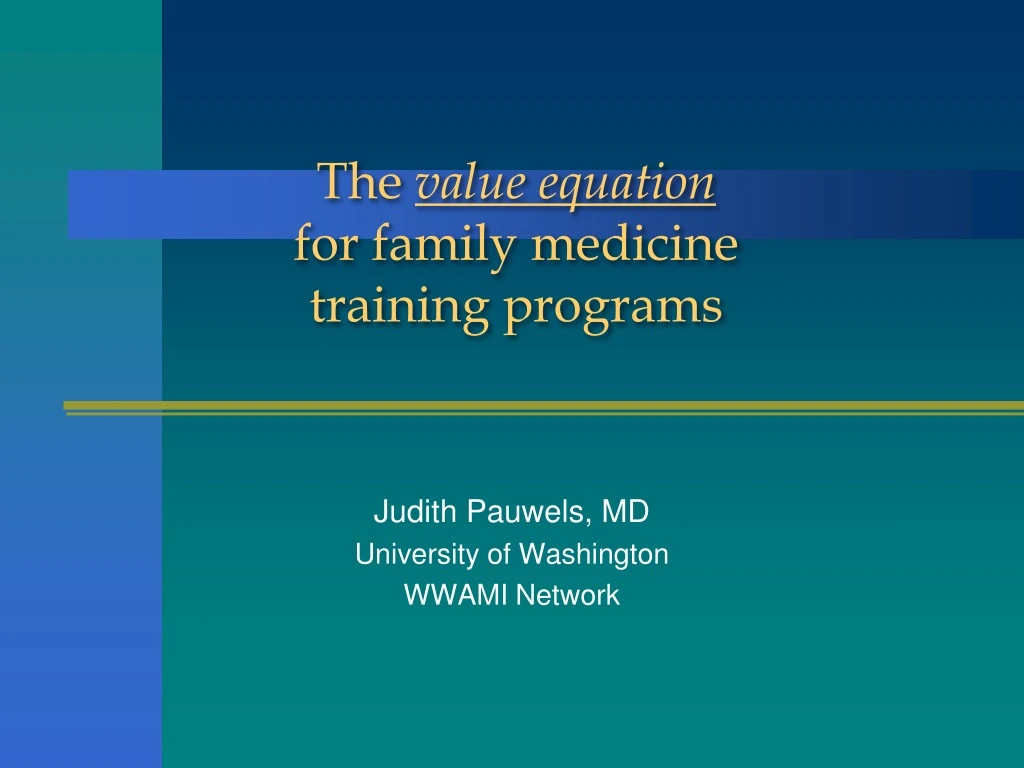
The value equationfor family medicine training programs Judith Pauwels, MD University of Washington WWAMI Network
What is the value of your program? • Value = benefits/costs (i.e., Program Impact / Finances
Goals • Identify key financial concepts that define the costs of programs. • Describe the benefits that programs bring to their institutions and communities. • Discuss what the “values equation” looks like for your program.
How sponsors look at programs: • “The CFO would like a meeting with you, …today!” • Why aren’t your faculty more productive? • “We need to cut 10% out of your program by next week” • How do you compare with MGMA?” • “How are you going to break even?”
How programs look at themselves: • What revenues and expenses are expected for programs? • What is the average “cost per resident”? • What variations must be considered? • How productive can residency programs be and still be educational? • What are typical staffing models for residency clinics? • What impacts have duty hours, PCMH, EHRs and other trends had on programs?
Costs: Essential data • Revenues • Expenses • Productivity • Staffing models
Residency revenues • Patient care reimbursements • FMC • Inpatient, nursing home, other • Other service reimbursements • Federal funding (Medicare GME) • Medicaid GME • Other federal sources • State funding • Grants, foundation support, other sources
Residency revenues • Patient care reimbursements • FMC • Specialty clinics • Inpatient, nursing home, other • Dependent on resident and faculty activity and reimbursement model – increases when all third year positions and faculty positions filled • Other service reimbursements • Medical directorships • Other service contracts • Administrative roles
Residency revenues • Federal funding (Medicare GME) • Medicaid GME • Other federal sources • AHECs • HRSA / FQHC • Teaching Health Center grants • PTCE grants • Veterans Administration
Residency revenues • State funding • Other sources: • Community Support • Foundation • Individual – e.g. naming rights • Direct Grants • Research • Other • Institutional direct support
Factors affecting revenue • Payer mix of patients • Billing and collections efficiencies (deductions, write-offs, AR, etc.) • Volume of patients seen • Service contracts (managed care; enhanced reimbursements) • RVU production
Residency expenses • Salary, benefits, retirement • Variable operational expenses • Fixed operational expenses • “Indirect” expenses or “overhead”: other costs not directly on the budget sheets but contributing to the support of the program
Residency expenses • Salary, benefits, retirement (faculty, residents, other providers, and support FPC and program staff) • Faculty salaries, benefits and support • Resident salaries, benefits and support • Educational staff • FMC staff • Stipends for other teachers (specialists, preceptors, etc.)
Faculty Role Avg Prog FTE 00-10 Director/ Admin. 1.2 - 1.4 Family Medicine 5.2 - 7.2 Internal Medicine 0.4 - 0.6 Pharmacy 0.3 - 0.6 Behavior Medicine 1.0 - 0.9 Other 0.3 - 0.4 Total Core Faculty 8.4 - 11.1 Network data: Structure of core faculty FTE
Staffing considerations • Nursing per 10,000 visits • RN/Nurse ratio • Physician Assistant or Nurse Practitioner per program • Ancillary Staff (lab, X-ray, Referrals, MSW, Nutritionist, etc.) • Central Business Office functions are common, limiting FPC staffing to data entry
Residency expenses • Variable operational expenses • Medical and non-medical supplies, pharmacy, transcription, etc. • IT expenses: hardware and software • Malpractice and other insurances
Residency expenses • Fixed operational expenses • Building/space, both clinic and administration • Maintenance • Equipment • Etc etc…
Residency expenses • “Indirect” expenses or “overhead”: other costs not directly on the budget sheets but contributing to the support of the program • Human resources • IT • Administration • Billing functions • Utilities • Highly variable among programs
Factors affecting expenses • Faculty number and structure • Staffing models of clinics • Allocations of institutional overhead • FPC and residency expenses
Productivity measures • Direct patient care activities • Indirect patient care activities (precepting, research, conferences, etc.)
Network data: Annual FPC productivity trends
Costs: revenues vs. expenses • Planning for a future in a complex and competitive environment: • Increase revenues • Patient care reimbursement • New federal funding sources • Grants • Philanthropy • Decrease expenses
What is the value of your program? • Value = benefits/costs (i.e., Program Impact / Finances
Program Impact • Direct patient care services provided • Inpatient Care • Outpatient Care • Community access • Specialty care: HIV, Hepatitis C, OB • Better health, lower costs
Program Impact • Underserved care • Community safety net • Specialty access: • HIV • Hepatitis • OB
Program Impact • Learning environment: • Quality of care in the institution • Enhancing the adoption of “new” knowledge • Regional CME • Research
Program Impact • New providers / graduates • Committed to the community and institution • Familiar with local environment • Reduced recruiting costs • Replacement provider costs
Program Impact • Direct “downstream” referrals • Catchment area
Program Impact • Other Benefits • Meeting state workforce needs • Community involvement • “Goodwill” in the community
What is the value of your program? • Value = benefits/costs (i.e., Program Impact / Finances
Presenting the “values equation” • Develop a “dashboard”: • Performance data • Financial summary • Trend information • Explain variations
Performance data: Patient volumes/mo New patient visits Productivity measures: pts/ hr RVU/ visit revenues/ visit Quality measures Financial summary: Patient care revenues Expenses FTE’s Flex expenses/ FTE Collections measures Trend information Explain variations Dashboard items
Presenting the “values equation” • Promote your program impact: • Patient services • Teaching/research achievements • Graduates • Community engagement
Summary • Understanding the financial pressures facing graduate medical education is crucial for program management. • Discussing revenues, expenses, productivity, and dashboards helps everyone work to address real needs for cost accountability. • Identifying and celebrating program impact helps everyone feel pride in the amazing work we are all doing on behalf of patients, and the future of our health care system.