Download
1 / 28
290 likes | 435 Views
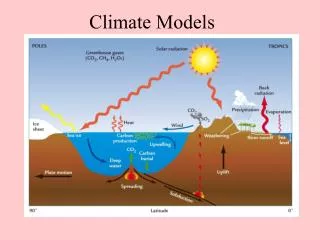
Constraining climate models with visible polarized radiances. Michael Mishchenko, Brian Cairns, and Andrew Lacis. Talking points: Information content of measurements: measurements cannot be used to constrain models unless they are sensitive to specific model parameters

E N D
Constraining climate models with visible polarized radiances Michael Mishchenko, Brian Cairns, and Andrew Lacis
Talking points: Information content of measurements: measurements cannot be used to constrain models unless they are sensitive to specific model parameters VIS is different from IR
AVHRR long-term record Global long-term record The famous switch from global solar dimming to solar brightening at around 1990 made the Earth less reflective (plot on the left) and accelerated global warming. The contemporaneous decrease in the amount of aerosols (plot below) may have been partly responsible for this phenomenon. IPCC, 2007 We do not know definitively whether the decreasing aerosol trend was real and, if yes, whether it was a natural or an anthropogenic event. Science 315, 1543 (2007)
Multi-decadal satellite data appear to reveal strong regional aerosol trends and demonstrate increasing pollution in Asia and reduced aerosol concentrations in much of Europe. Aerosol optical thickness difference between the early 2000s and late 1980s Global long-term record
Comparisons of MODIS and MISR pixel-level retrievals There have been parallel claims of unprecedented accuracy of aerosol retrievals with the Moderate-Resolution Imaging Spectroradiometer (MODIS) and Multiangle Imaging SpectroRadiometer (MISR). These claims have been based on limited comparisons with ground-based observations which, however, are not necessarily indicative of the actual global performance of these satellite sensors. Fortunately, both instruments have been flown for many years on the same Terra platform, which provides a unique opportunity to compare fully collocated pixel-level MODIS and MISR aerosol retrievals directly and globally.
Comparisons of MODIS and MISR pixel-level retrievals • A MODIS-Terra level-2 aerosol pixel and a MISR level-2 aerosol pixel are defined as “fully compatible” if they • are located within the narrower MISR swath; • have been collocated spatially to ±3.3 km and temporally to ±3 min; • have been determined to be “cloud-free” by both cloud-screening procedures; and • have been identified as suitable for aerosol retrieval and have been taken through the standard MODIS and MISR retrieval routines, thereby resulting in specific AOT and AE values.
Comparisons of MODIS and MISR pixel-level retrievals Scatter plots of fully compatible MISR vs. MODIS-Terra AOTs for January 2006. The straight dotted line depicts the 1-to-1 perfect agreement. J. Quant. Spectrosc. Radiat. Transfer109, 2376 (2008)
Comparisons of MODIS and MISR pixel-level retrievals MISR vs. MODIS-Terra Ångström exponents (AEs). The straight dotted lines depict the 1-to-1 perfect agreement. J. Quant. Spectrosc. Radiat. Transfer109, 2376 (2008)
Comparisons of MODIS and MISR pixel-level retrievals Absolute MODIS–MISR differences averaged over the summer months (June, July, and August) of 2001–2008.
Comparisons of MODIS and MISR pixel-level retrievals • STD plots show that pixel-level MODIS–MISR differences remain large and virtually constant over ~8 years. • The MISR average AOT is systematically larger than the MODIS-Terra average AOT over the oceans by about 0.01–0.03. • The MODIS-Terra and MISR AOT averages over the land do not show a similar systematic disagreement. • The MISR global monthly AE average is significantly greater than the MODIS-Terra global monthly AE average, especially over the oceans. • The MODIS-Terra and MISR seasonal oscillations in AE are systematically antiphased. • Both the MODIS-Terra and the MISR average AOTs show virtually no long-term tendency over the oceans and oscillate around the long-term average values 0.12 and 0.13, respectively. • Both satellite products exhibit a weak increasing AOT tendency over the land. • The MISR AE curves show no discernable tendencies, whereas the MODIS-Terra AE record over the land appears to exhibit a weak decreasing tendency (growing particles).
Comparisons of MODIS and MISR pixel-level retrievals Our extensive analysis of ~8 years of the MODIS-Terra and MISR aerosol data reveals a troubling picture and documents unexpected profound disagreements at the pixel level as well as between long-term and spatially averaged aerosol properties. The only point on which both datasets seem to fully agree is that there has been a weak increasing tendency in the globally averaged aerosol optical thickness (AOT) over the land and no long-term AOT tendency over the oceans. Overall our new results suggest that the current knowledge of the global distribution of the AOT and, especially, aerosol microphysical characteristics remains highly unsatisfactory.
Polarized radiances A beam of light is fully characterized by four polarized radiances (Stokes parameters) having the same dimension of W m–2 sr–1 : I −I ≤Q ≤I −I ≤ U ≤I −I ≤ V ≤I V is usually small and difficult to measure and carries little information.
Polarimetry at NIST Polarimetry at NIST
Polarization is very sensitive to aerosol particle size and refractive index
Polarimetry Q and U can be measured in much the same way as I. However, |Q| and |U| are often (much) smaller than I, which often causes a problem. Example: I = 1 ΔI = ±0.02 Q = 0.02 ΔQ = ±0.02 U = –0.01 ΔU = ±0.02 Q and U cannot be measured.
Polarimetry However, the ratios −1 ≤ Q/I ≤ 1 −1 ≤ U/I ≤ 1 can be measured extremely accurately. Astrophysicists can measure them to ±0.000001. The Glory APS will measure them to ±0.001. Example: I = 1 ΔI = ±0.02 Q = 0.02 ΔQ = ±0.001 U = –0.01 ΔU = ±0.001 Q and U can be measured quite accurately despite their small absolute values.
Glory APS strategy: fully exploit the information content of the reflected sunlight Classification of passive remote sensing techniques by 1. Spectral range 2. Scattering geometry range 3. Number of Stokes parameters Hierarchy of existing/planned instruments: AVHRR MODIS, MISR, VIIRS Glory APS • The measurement approach developed for the Glory mission is to use multi-angle multi-spectral polarimetric measurements because: • Polarization is a relative measurement that can be made extremely accurately. • Polarimetric measurements can be accurately and stably calibrated on orbit. • The variation of polarization with scattering angle and wavelength allows aerosol particle size, refractive index and shape to be determined. • Appropriate analysis tools are available.
“Must haves” of an SI-traceable SW photopolarimeter Precise polarimetry particle size distribution, refractive index, and shape (~0.001): Wide scattering particle size distribution, refractive index, and shape angle range (i + p): Multiple (60) (i) cloud particle size via rainbow angle angles (i + p): (ii) particle size, refractive index, and shape (iii) ocean surface roughness (iv) aerosol retrievals in cloud-contaminated pixels Wide spectral range (i) separation of submicron and supermicron particles (i + p): (ii) spectral refractive index chemical composition 1370 nm (i + p): characterization of thin cirrus clouds 2200 nm (p): (i) characterization of the land surface contribution at visible wavelengths (ii) cloud particle sizing
Retrievals with aircraft prototype of APS • Spectral AOT values retrieved from precise polarimetric measurements agree exceedingly well with those measured by ground-based sunphotometers over an AOT range from 0.05 to more than 1. • The absence of spectrally-dependent biases demonstrates the reliability of the size distribution estimate for both small and large modes of a bimodal aerosol distribution. • In situ and retrieved size distributions also agree extremely well (difference in aerosol effective radius of less than 0.04 µm).
Role of polarization accuracy Range of acceptable retrievals for different levels of polarimetric and radiometric accuracy.
Retrievals with aircraft prototype of APS • Low-altitude reflectance and polarized reflectance bare soil vegetation • Measurements of two different surface types at 410, 470, 555, 670, 865, 1590 and 2250 nm (blue, mauve, turquoise, green, red, magenta, black) with different viewing geometries. • Solid lines are bare soil, dashed lines are vegetation. These are single aggregated scans of a single pixel. Imperfection are primarily due to yaw. • Reflectances of different surface types show significant variations in color. Polarized reflectance of different surface types is dominated by geometry.
Retrievals with aircraft prototype of APS Polarized observations of clouds are sensitive to the cloud droplet size distribution (rainbow), the cloud top pressure (side scattering in the blue UV) and aerosols above the cloud (side scattering in the red/NIR/SWIR).
Role of polarization in radiance calibration transfer Two critical problems: 1. Polarization sensitivity of radiometers 2. Inaccuracy of BRDF extrapolation
Retrievals with aircraft prototype of APS BEFLUX is the ground based estimate of the total solar directional hemispheric reflectance at the DoE ARM SGP CF. The RSP estimate of DHR comes from a single snapshot (i.e. instantaneous) while the MODIS processing stream uses sixteen days of data to reduce the effects of aerosols, clouds and increase angular sampling.
Retrievals with aircraft prototype of APS Reflectance and polarized reflectance observations are sensitive to different depths in a cloud which is diagnostic of cloud life cycle (adiabatic profile for recently formed cloud, but not for a dissipating/drizzling cloud). Similar information is also provided by the width of the droplet size distribution which is very narrow for active/recently formed clouds. The table below shows that the droplet size distribution retrieval is consistent with in situ measurements.