Download
1 / 12
140 likes | 307 Views
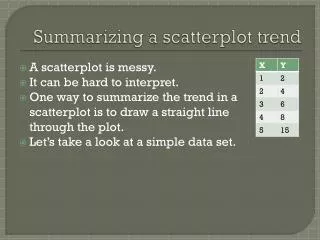
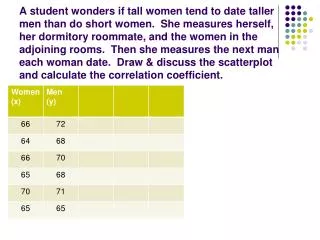
Describe the scatterplot. Direction: Form: Strength:. Two –Variable Data Analysis. Source: 5 Steps to a 5 Book. Standard. Construct and interpret a scatterplot for a set of bivariate data. Vocabulary.

E N D
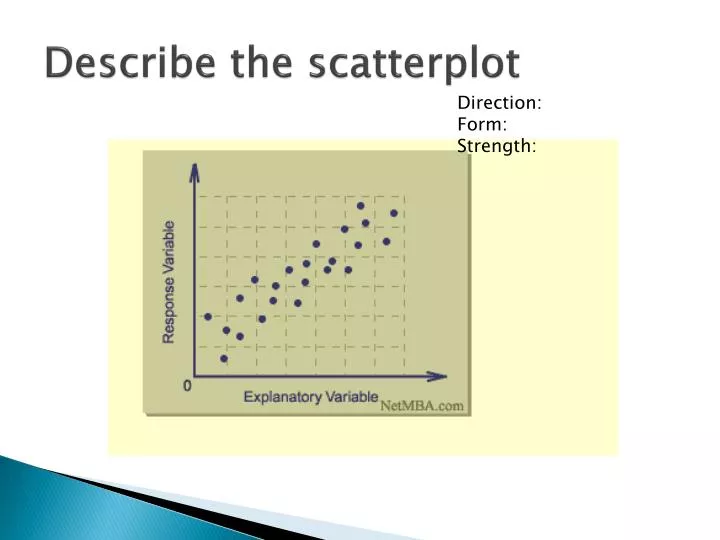
Describe the scatterplot Direction: Form: Strength:
Two –Variable Data Analysis Source: 5 Steps to a 5 Book
Standard Construct and interpret a scatterplot for a set of bivariate data.
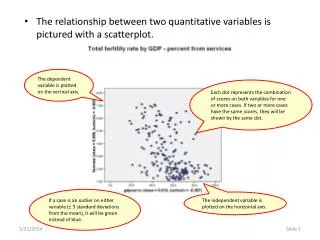
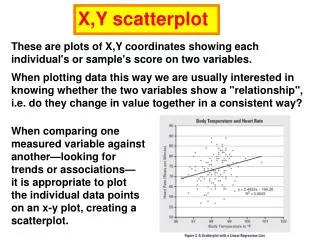
Vocabulary • Scatter plot-Displays the relationship between two quantitative variables. Must label the x and y axis. The scale on x and y axis must be uniform. Use the whole grid given on AP test. • Explanatory Variable- explains or influences changes in a response variable(horizontal axis) • Response Variable- (vertical axis)measures an outcome of a study
Scatterplots • Make a scatterplot of the time studying for test verses the test grade • Put this data in your calculator. What is the explanatory variable? What is the response variable?
Interpreting a Scatterplot • Look for overall patterns and for striking deviations • Describe the direction, form, and strength of the relationship. • Direction: Positive, Negative, No Association • Form: Linear or Nonlinear • Strength: Strong, Moderate, or Weak • Look for outliers
Association ( Directions) • Positive • Negative • No Association
Linear relationship • Correlation Coefficent(r)- This measures the strength and direction of a linear relationship ( On AP free response-you must mention both) • The calculator will find r for you. However, we will do one example to let you see where the formula is coming from.
Correlation (r) • Correlation Applet • http://www.rossmanchance.com/applets/guesscorrelation/GuessCorrelation.html
Continue • Make a scatter plot to determine the direction, strength, and form • Use your data to find r. • Show work-Then check with the calculator