Download
1 / 25
250 likes | 254 Views
This presentation provides an overview of the 2018 Farm Bill, covering topics such as commodities, conservation, trade, nutrition, and more. It also discusses the impact of tariffs on agricultural exports.

E N D
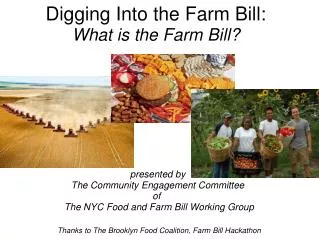
Farm Bill & Tariffs July 12, 2019 Chad Hart Associate Professor/Crop Marketing Specialist chart@iastate.edu 515-294-9911
2018 Farm Bill Overview12 Chapters • Commodities • Conservation • Trade • Nutrition • Credit • Rural Development • Research, Extension, and Related Matters • Forestry • Energy • Horticulture • Crop Insurance • Miscellaneous From National Park Service
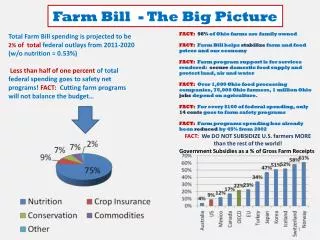
Farm Bill BudgetProjected Outlays, FY2019-2028$867 Billion Source: Congressional Research Service and Congressional Budget Office
What stays the same? • ARC and PLC programs remain • Crop Insurance: no means testing; harvest price stays • Income limitation: still at $900,000 of average adjusted gross income over the 3 previous taxable years. • Conservation programs (minor changes) • Work requirements for food stamps program (SNAP) • No projected increase in the federal deficit (compared to prior projections) • Disaster assistance remains with permanent authority and mandatory funding
PLC pays, ARC does not Neither pay Both pay ARC pays, PLC does not
ARC & PLC Programs New 2018 FB: Seed cotton, rice (temperate japonica)
What’s new? • Revised ARC & PLC: switching • PLC yield update • Higher Loan Rates for MAP & LDP • Improved dairy assistance • Industrial hemp • Expands family member definition for payment limits and eligibility rules to include first cousins, nephews and nieces
What’s new? • Crop Insurance: • Changes beginning farmer and rancher definition to 10 years for insurance benefit purposes • Cover crops “good practice farming” • APH Changes • Hemp Insurance • Catastrophic Crop Insurance • Yield Reporting
Why do U.S. farmers need export markets? • That’s where the customers are • That’s where the economic growth is • That’s where the consumption growth is • We produce surpluses • We only eat high on the hog • Exports are crucial to farm income
Value of Ag Trade Source: USDA-FAS
U.S. Ag Exports Source: USDA-FAS
Top ten US ag export markets, 2018 Source: US Census Bureau, Foreign Trade Statistics, FATUS export aggregations
NAFTA Agricultural trade with Canada Two-way trade up 405% since NAFTA Source: US Census Bureau, Foreign Trade Statistics, FATUS export aggregations
NAFTA Agricultural trade with Mexico Two-way trade up 602% since NAFTA Source: US Census Bureau, Foreign Trade Statistics, FATUS export aggregations
USMCA Source: USDA-FAS
Tariffs • A tax on imports • Used to reduce trade and protect domestic industries • Has both positive and negative impacts • Positive for domestic producers of the product with the tariff • Negative for domestic consumers of the product with the tariff • If specifically targeted against one country, then impacts are • Positive for that country’s consumers • Negative for that country’s producers
Tariff Effects Source: Austin Donisan, CC BY 3.0, https://commons.wikimedia.org/w/index.php?curid=6868997
Example: China’s Soybean Tariff • Positive for China’s soybean producers and U.S. soybean consumers • Chinese soybean producers capture a higher price • U.S. soybean consumers capture a lower price • Negative for China’s soybean consumers and U.S. soybean producers • Chinese soybean consumers pay a higher price • U.S. soybean producers receive a lower price • Price effects are due to supply changes • Less U.S. soybeans imported by China • More U.S. soybeans left on domestic market
Tariffs are a Policy Tool • Can be used to: • Reduce trade deficits • Raise government funds • Protect specific industries • Serve as a bargaining chip in trade negotiations • They’re not new. We’ve had tariffs on many goods since the U.S. was founded. • Major shifts in U.S. tariffs in: • 1789, 1790, 1792, 1816, 1824, 1828, 1832, 1833, 1842, 1846, 1857, 1861, 1872, 1875, 1883, 1890, 1894, 1897, 1909, 1913, 1921, 1922, 1930, 1934, 1947, 1962, 1974, 1979, 1984, 1988, 1994, 2002, 2009, 2018
Recent Movement in the Top 3 Source: USDA-FAS
Global Shares Source: USDA
Want to provide feedback on my presentation?https://www.surveymonkey.com/r/ChadHart
Thank you for your time!Any questions?My web site:http://www2.econ.iastate.edu/faculty/hart/Iowa Farm Outlook:http://www2.econ.iastate.edu/ifo/Ag Decision Maker:http://www.extension.iastate.edu/agdm/