Download
1 / 30
300 likes | 404 Views
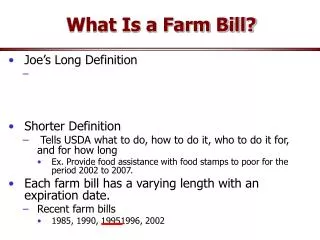
What to Expect when you’re Expecting a Farm Bill. Paul D. Mitchell Associate Professor of Agricultural & Applied Economics University of Wisconsin-Madison Wisconsin Counties Association: Ag Steering Committee Madison, WI July 15, 2013. Today’s Goal. O verview of existing Farm Programs

E N D
What to Expect when you’re Expecting a Farm Bill Paul D. Mitchell Associate Professor of Agricultural & Applied Economics University of Wisconsin-Madison Wisconsin Counties Association: Ag Steering Committee Madison, WI July 15, 2013
Today’s Goal • Overview of existing Farm Programs • How we spend about $15 billion/year • Overview of likely changes in programs • 8-10% cut in the $15 billion • More emphasis on crop insurance
Average Annual Outlays Under 2008 Farm Bill Direct Payments (DP) $4.9 bil Crop Insurance $8.3 bil Counter-Cyclical Payments (CCP) $0.559 bil Risk Management (field & specialty crops) $8.4 bil Commodity Programs (field crops) $6.0 bil OR Average Crop Revenue Election (ACRE) $0.311 bil Farm Safety Net $15 bil Non-insured Disaster Assistance (NAP) $0.1 bil Marketing Assistance Loans $0.225 bil Loan Deficiency Payments (LDP) $0.225 bil Supplemental Revenue Assistance Payments Program (SURE) Livestock Indemnity Program Ad hoc disaster payments Livestock Forage Disaster Program Disaster Assistance (crops & livestock) $0.75 bil Emergency Assistance for Livestock, Honey Bees, and Farm-Raised Fish Program Tree Assistance Program Emergency Disaster Loans Source: http://ncseonline.org/NLE/CRSreports/10Oct/R41317.pdf
2009 Total Payments (DCP, ACRE, LDP, SURE, MILC, CRP, Premium Subsidies)
Share of 2009 Total Payments from Crop Insurance Premium Subsidies
WI Net Farm Income and GovtPymts($ Billion, not including premium subsidies)
% Net Cash Income from Government Payments (not including premium subsidies)
Crop Insurance Subsidies • USDA develops policies, rules, and premium rates • Pays development & administration costs • USDA subsidizes the premiums ($6.9 billion in 2012) • Farmers pay ~35%-40% of fair premiums on average • USDA subsidizes companies for Administration and Operating ~18%-20% of premiums ($1.3 Billion in 2012) • USDA reinsures the insurance companies, plus retains some of the policies • Means USDA pays some of the indemnities • Corn & Soy: 50% of acres, 60% of subsidies & premiums, 70% of liability, 80% of indemnities (2012)
Main Point • About $15 billion annually given out in farm program payments and crop insurance premiums subsidies • $7 billion in commodity support/disaster assistance • $8 billion in crop insurance premium subsidies • WI does all right, with several counties > $10 million/year, $200-600 million per year (not including crop insurance) • Even more payments in net crop insurance indemnities • Many WI counties $20-$40/A annual average • 2012 in WI: $175 million premium subsidies and $450 million indemnities = $525 million
2013? 2014? 201? Farm Bill • Summer 2012 • Senate passed a Farm Bill • House Ag Committee Passed Farm Bill • Eventually failed, this a quick summary
Proposed Cuts ($ Billion per Year) -9% ~-33% • Senate and House Ag essentially the same • Debate was about how muchto cut nutrition programs and how to support commodity ag • Both emphasize crop insurance even more
Farm Safety Net: Replace Farm Programs • Proposed Farm Bill Commodity Support to cover “Shallow Losses” not covered by crop insurance • Create programs to cover part of “deducible” • With a 75% RP policy, farmer “pays” the first 25% of revenue losses below average revenue • Shallow Loss programs pick up part of deductible • Senate: Agriculture Risk Coverage (ARC) • House Ag: Revenue Loss Coverage (RLC) • Farmer pays first 11%-15% of losses, ARC/RLC cover up to 10% of additional losses
Main Point • Crop insurance likely to become an even greater part of commodity support • Commodity support becoming programs layered on top of crop insurance for shallow loss coverage • Currently no crop disaster program: Buy crop insurance • Other Changes to expect • Reduced premium subsidies • Conservation requirements for crop insurance
Conservation Reserve Program Payments 2009($1.87 billion in 2009, $1.75 billion in 2012)
Conservation Programs • Farm Bill proposals cut CRP by about 1/3 • More emphasis on crop insurance, less on farm programs, and cuts to CRP and low CRP re-enrollment • Concerns about soil erosion, wetlands, environment, etc. • Conservation compliance restrictions for crop insurance • More use of crop insurance as a policy tool for non-risk management purposes
Conclusion • About $15 billion per year in government payments to US farmers ($375-$775 million to WI farmers) • More than half $ for crop insurance at US level • A little less than half in WI for crop insurance • New Farm Bill, if it ever passes, will likely cut this ~8-10% and put even more emphasis on crop insurance
Thanks for Your Attention!Questions? Paul D. Mitchell Agricultural and Applied Economics University of Wisconsin, Madison, WI pdmitchell@wisc.edu 608-265-6514 http://www.aae.wisc.edu/pdmitchell/extension.htm Follow me on Twitter: @mitchelluw
Crop Insurance Data for 2012 (all units in Millions) • Premium subsidies = $6.9 billion (63%) • Subsidies to companies $1.3 billion • USDA administration costs = ???, indemnities = ???
Corn and Soybeans Dominate Crop Insurance(2012 Data) • About 50% of the acres • About 60% of the subsidies and premiums • About 70% of the liability • About 80% of the indemnities
Proposed Commodity Program Changes • Direct Payments: both eliminated • Counter-Cyclical Payments: both eliminated • ACRE Program: both eliminated • Disaster Programs: both eliminated SURE • Keep other programs (LIP, LFP, ELAP, TAP) • Marketing Assistance Loans and Loan Deficiency Payments: both kept and kept same loan rates • Created new Farm Safety Nets