Download
1 / 22
230 likes | 329 Views
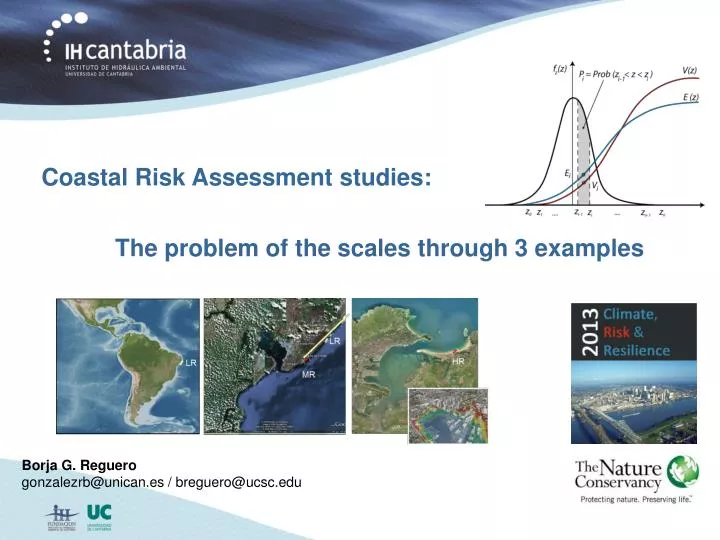
Coastal Risk Assessment studies: . The problem of the scales through 3 examples. Borja G. Reguero gonzalezrb@unican.es / breguero@ucsc.edu. 3 scales. Spatial scales in the coastal areas : 0.50º ~ 50 Km = Global ( Low Resolution , LR )

E N D
Coastal Risk Assessment studies: The problem of the scales through 3 examples Borja G. Reguero gonzalezrb@unican.es / breguero@ucsc.edu
3 scales • Spatialscales in thecoastalareas: • 0.50º ~ 50 Km = Global (LowResolution, LR) • 0.05º ~ 5 Km = Regional (Medium Resolution, MR) • 10 m – 100 m = Local (High Resolution, HR) LR HR LR MR National / International e.g., LAC Country / region e.g. GulfCoast, US Local site e.g., city Data + detail/resolution of processes
Case 1. The Macro Scale: e.g., Latin America and the Caribbean Case 2. The Micro Scale: e.g., The city of Santander (SP) Case 3. The Meso Scale: e.g., Gulf Coast
Case 1. The Macro Scale: e.g., Latin America and the Caribbean Case 2. The Micro Scale: e.g., The city of Santander (SP) Case 3. The Meso Scale: e.g., Gulf Coast “ Identifying priorities“ (process-integrated approach)
Vulnerability Exposure Hazardvalue Regional study on the effects of Climate Change in the coast of Latin America and the Caribbean European Commission terminology (Schneiderbauer and Ehrlich, 2004) Risk(R) is defined as “the probability of harmful consequences or expected losses resulting from a given hazard to a given element at danger or peril, over a specified time period” (Natural Disasters)
Regional study on the effects of Climate Change in the coast of Latin America and the Caribbean
Coastal Flooding • Beach Erosion • Port activity and reliability • Coral Bleaching • Sediment potential transport • Eolic potential transport Impacts Dynamics
Example of Risk integration 2: Reliability of Defensive Breakwaters Type of sea-port as a function of its socio-economic relevance Hazard Vulnerability Exposure Length to repair Change in design probability level
Case 1. The Macro Scale: e.g., Latin America and the Caribbean Case 2. The Micro Scale: e.g., The city of Santander (SP) Case 3. The Meso Scale: e.g., Gulf Coast “ Going to the detail “ (process based approach)
DSS-Santander followstheSPRCmethodology (Source, Pathway, Receptor, Consequences) • changevulnerability • changehazard f(R) R
Case 1. The Macro Scale: e.g., Latin America and the Caribbean Case 2. The Micro Scale: e.g., The city of Santander (SP) Case 3. The Meso Scale: e.g., Gulf Coast
Hazard Sets Scenarios CLIMADA Storm generation Atmospheric hazards Coastal hazards Hs SS Precip. W pFH • NOTES: • First order of complexity (1D) • Statistical simulation • Additional advances: • SWAN-Veg • Adcirc • VOF-RANS runs Wave attenuation model (InVest Coastal Protection tool) Coastal profile pFHinsh. pFH Ecosystems protective services pFH inshore Impacts on assets Damages, Events Losses Sets Cost/Benefit of adaptation measures
1. Databases www.coastalresilience.org www.unisys.com www.nooa.com …. Hazard data (hurricanes and LT trends) Bathymetry & topography Types of ecosystems, coastal defenses and coastal profiles Socio-economic Vulnerability data (population, coastal assets, etc.)
1. Databases 2. Generation of Hazard sets (Wind, precip., SS, Waves)
1. Databases 2. Generation of Hazard sets (Wind, precip., SS, Waves) 3. Coastal features and possible adaptation options (role of green/gray infrastructure)
1. Databases 2. Generation of Hazard sets (Wind, precip., SS, Waves) 3. Coastal features and possible measures (role of green/gray infrastructure) 4. Evaluation of potential damages and overall risk • Comparison of each scenario: • Current situation • Economic growth scenario • Scenarios with future changes in (i) hazards, (ii) ecosystems and/or (iii) measures adopted e.g. USGS, CVI
Summary • Each scale presents different features (i.e. data) and requires different tools • Processes-integrated vsProcesses-resolving tools • Overall, a similar approach = Risk Framework • By comparison of scenarios (risk together with the other terms): • identify where and (possibly) what “solutions” to study further
Thank you I.J. Losada F.J. Méndez M. Beck C. Sheppard Borja G. Reguerogonzalezrb@unican.es Acknowledgements: ECLAC, OECC-SP Gob., NOAA, TNC, NatCap Sources of pictures in the presentation: TNC, NOAA, USACE, USGS, Swiss Re, online press
Example of riskintegration 1: ErosionRisk (Sandy Beaches) 2 functions: • Coastal Urban areas protection • Resource (Tourism) Beaches as a resource Urbanbeaches as a natural protection
Risk Assessment in a changing climate V(z) • changevulnerability • changehazard f(z) f(R) R
Sources Pathways Receptors & Consequences INPUTS FUNCTION OUTPUTS depth, population, patrimonial_value - inland_consequences- loss_life, edr vel_x, vel_y, habitat_id - outland_consequences- evi hs, tp, wave_dir, eta_ast, eta_met, bathy_dir,… - beach- xb, hs, q_long, v_long, dean_par,depth hs, tp,wave_dir, eta, bathy_dir, h_ini, h_end - shoal- hs, wave_dir hs, eta, hc, length - sea_wall- q hs, tp, wave_dir, eta_ast, eta_met - offshore_to_coast - hs, tp, wave_dir, eta,depth, vel_x, vel_y FLOODING MODEL