Download
1 / 15
150 likes | 155 Views
This study analyzes the performance of 30 models in matching observations from 47 Flux Tower Sites, including AmeriFlux and Fluxnet Canada. The analysis focuses on factors such as water table dynamics, spectral NEE error, wavelet coherence, phenology, and light use efficiency. The study identifies areas for model development, such as improving phenology, including more soil layers and vegetation pools, and refining slope to LUE curve.

E N D
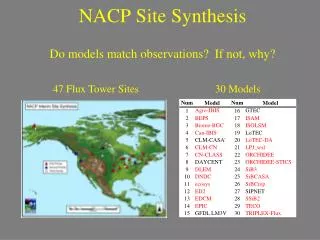
Results from the NACP Site-level Interim Synthesis (NACP Site Synthesis) Kevin Schaefer NACP Site Synthesis Team Flux Tower PIs Modeling Teams
Do models match observations? If not, why? 47 Flux Tower Sites 30 Models 36 AmeriFlux 11 Fluxnet Canada 24 submitted output 10 runs per site
Analysis Projects Submitted Prev. Talk Published
Wetland Sites (Desai et al.) Residuals correlate to water table depth Models should include water table dynamics Reco residuals Residuals mmol m-2 s-1 GPP residuals Residuals mmol m-2 s-1 Water Table Depth (cm)
Spectral NEE Error (Dietze et al.) Annual • Error peak at diurnal & annual time scales • Errors at synoptic & season time scales Season Diurnal Synoptic Not Significant
NEE Wavelet Coherence (Stoy et al.) Models match observations only some of the time SiB at US-UMB Annual Significant Season Synoptic Time Scale (hours) Diurnal Hour
NEE Seasonal Cycle (Schwalm et al.) Add vegetation pools 0.6 0.5 Taylor Skill 0.4 0 3 4 6 7 8 9 Number Veg Pools Improve prognostic phenology 0.6 Phenology Taylor Skill 0.5 0.4 Semi-Prog Prognostic Prescribed 0.6 Add soil layers Taylor Skill 0.5 0.4 0 1 2 7 9 10 11 15 3 Number Soil Layers
Phenology (Richardson et al.) Early/late uptake means positive GPP bias Models need better phenology
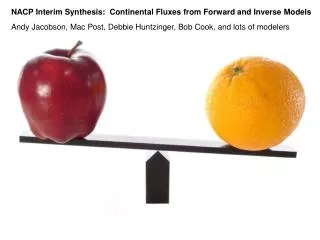
Regional vs. Site (Raczka et al.) Enzyme kinetic & LUE models show opposite bias Flux Towers Light Use Efficiency Enzyme Kinetic
GPP Annual Bias (Schaefer et al.) Slope of LUE Curve drives Annual bias Models need better Vmax, leaf-to-canopy scaling, … US-Me2 Light Use Efficiency Curve Observed Simulated Daily Average GPP (mmol m-2 s-1) Daily Average Shortwave Radiation (W m-2)
Summary • Biases in GPP, but LH looks OK • Areas of model development: • Better Phenology • More soil layers/veg pools • Slopes to LUE curve • Water table dynamics • Crop parameterizations
Annual GPP Bias due to Phenology Evergreen sites Deciduous sites 40±80 160±145 -5±65 75±130
Multi-Model wavelet Coherence Scale (hours)
NEE Seasonal Cycle (Schwalm et al.) Our 1st published paper! Perfect Model Taylor Skill Normalized Mean Absolute Error Chi-squared