Download
1 / 1
10 likes | 239 Views
The Missouri Ozark Site. Modeling ecosystem-level carbon fluxes using an advanced land surface model (FAPIS) coupled to the Regional Atmospheric Modeling System (RAMS). Jesse N. Miller 1 , Lianhong Gu 1 , and W. Mac Post 1

E N D
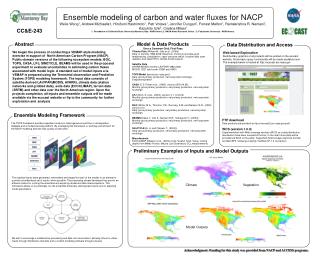
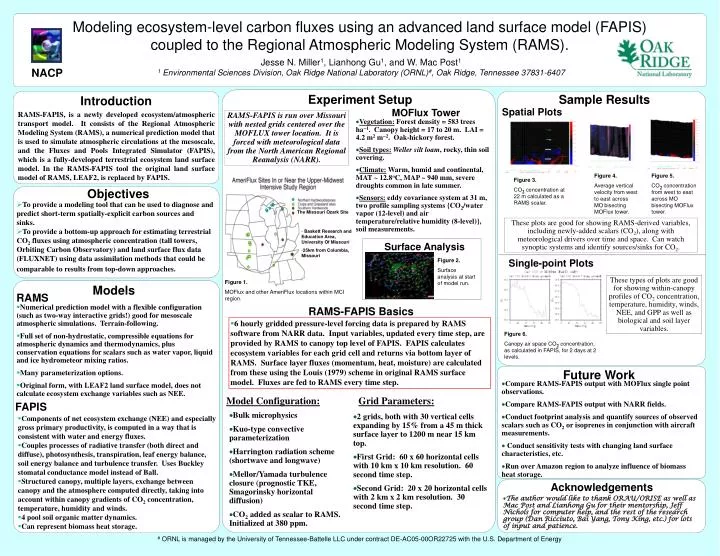
The Missouri Ozark Site Modeling ecosystem-level carbon fluxes using an advanced land surface model (FAPIS) coupled to the Regional Atmospheric Modeling System (RAMS). Jesse N. Miller1, Lianhong Gu1, and W. Mac Post1 1 Environmental Sciences Division, Oak Ridge National Laboratory (ORNL)#, Oak Ridge, Tennessee 37831-6407 NACP Experiment Setup Sample Results Introduction Spatial Plots MOFlux Tower RAMS-FAPIS, is a newly developed ecosystem/atmospheric transport model. It consists of the Regional Atmospheric Modeling System (RAMS), a numerical prediction model that is used to simulate atmospheric circulations at the mesoscale, and the Fluxes and Pools Integrated Simulator (FAPIS), which is a fully-developed terrestrial ecosystem land surface model. In the RAMS-FAPIS tool the original land surface model of RAMS, LEAF2, is replaced by FAPIS. RAMS-FAPIS is run over Missouri with nested grids centered over the MOFLUX tower location. It is forced with meteorological data from the North American Regional Reanalysis (NARR). • Vegetation: Forest density = 583 trees ha1. Canopy height = 17 to 20 m. LAI = 4.2 m2 m2.Oak-hickory forest. • Soil types: Weller silt loam, rocky, thin soil covering. • Climate: Warm, humid and continental, MAT ~ 12.8oC, MAP ~ 940 mm, severe droughts common in late summer. • Sensors:eddy covariance system at 31 m, two profile sampling systems {CO2/water vapor (12-level) and air temperature/relative humidity (8-level)}, soil measurements. Figure 4. Average vertical velocity from west to east across MO bisecting MOFlux tower. Figure 5. CO2 concentration from west to east across MO bisecting MOFlux tower. Figure 3. CO2 concentration at 22 m calculated as a RAMS scalar. Objectives • To provide a modeling tool that can be used to diagnose and predict short-term spatially-explicit carbon sources and sinks. • To provide a bottom-up approach for estimating terrestrial CO2 fluxes using atmospheric concentration (tall towers, Orbiting Carbon Observatory) and land surface flux data (FLUXNET) using data assimilation methods that could be comparable to results from top-down approaches. These plots are good for showing RAMS-derived variables, including newly-added scalars (CO2), along with meteorological drivers over time and space. Can watch synoptic systems and identify sources/sinks for CO2. • Baskett Research and Education Area, University Of Missouri • 25km from Columbia, Missouri Surface Analysis Figure 2. Surface analysis at start of model run. Single-point Plots These types of plots are good for showing within-canopy profiles of CO2 concentration, temperature, humidity, winds, NEE, and GPP as well as biological and soil layer variables. Figure 1. MOFlux and other AmeriFlux locations within MCI region. Models RAMS • Numerical prediction model with a flexible configuration (such as two-way interactive grids!) good for mesoscale atmospheric simulations. Terrain-following. • Full set of non-hydrostatic, compressible equations for atmospheric dynamics and thermodynamics, plus conservation equations for scalars such as water vapor, liquid and ice hydrometeor mixing ratios. • Many parameterization options. • Original form, with LEAF2 land surface model, does not calculate ecosystem exchange variables such as NEE. RAMS-FAPIS Basics • 6 hourly gridded pressure-level forcing data is prepared by RAMS software from NARR data. Input variables, updated every time step, are provided by RAMS to canopy top level of FAPIS. FAPIS calculates ecosystem variables for each grid cell and returns via bottom layer of RAMS. Surface layer fluxes (momentum, heat, moisture) are calculated from these using the Louis (1979) scheme in original RAMS surface model. Fluxes are fed to RAMS every time step. Figure 6. Canopy air space CO2 concentration, as calculated in FAPIS, for 2 days at 2 levels. Future Work • Compare RAMS-FAPIS output with MOFlux single point observations. • Compare RAMS-FAPIS output with NARR fields. • Conduct footprint analysis and quantify sources of observed scalars such as CO2 or isoprenes in conjunction with aircraft measurements. • Conduct sensitivity tests with changing land surface characteristics, etc. • Run over Amazon region to analyze influence of biomass heat storage. Model Configuration: Grid Parameters: FAPIS • Bulk microphysics • Kuo-type convective parameterization • Harrington radiation scheme (shortwave and longwave) • Mellor/Yamada turbulence closure (prognostic TKE, Smagorinsky horizontal diffusion) • CO2 added as scalar to RAMS. Initialized at 380 ppm. • 2 grids, both with 30 vertical cells expanding by 15% from a 45 m thick surface layer to 1200 m near 15 km top. • First Grid: 60 x 60 horizontal cells with 10 km x 10 km resolution. 60 second time step. • Second Grid: 20 x 20 horizontal cells with 2 km x 2 km resolution. 30 second time step. • Components of net ecosystem exchange (NEE) and especially gross primary productivity, is computed in a way that is consistent with water and energy fluxes. • Couples processes of radiative transfer (both direct and diffuse), photosynthesis, transpiration, leaf energy balance, soil energy balance and turbulence transfer. Uses Buckley stomatal conductance model instead of Ball. • Structured canopy, multiple layers, exchange between canopy and the atmosphere computed directly, taking into account within canopy gradients of CO2 concentration, temperature, humidity and winds. • 4 pool soil organic matter dynamics. • Can represent biomass heat storage. Acknowledgements • The author would like to thank ORAU/ORISE as well as Mac Post and Lianhong Gu for their mentorship, Jeff Nichols for computer help, and the rest of the research group (Dan Ricciuto, Bai Yang, Tony King, etc.) for lots of input and patience. # ORNL is managed by the University of Tennessee-Battelle LLC under contract DE-AC05-00OR22725 with the U.S. Department of Energy