Download
1 / 25
250 likes | 257 Views
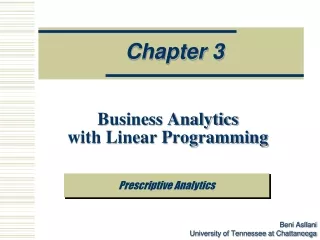
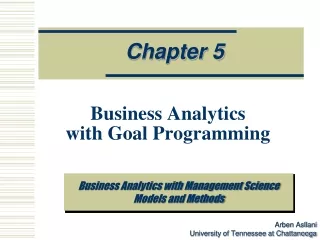
CHAPTER 7. Business Analytics with Shipment Models. Arben Asllani University of Tennessee at Chattanooga. Prescriptive Analytics. Business Analytics with Management Science Models and Methods. Chapter Outline. Chapter Objectives Prescriptive Analytics in Action: Danaos Corporation

E N D
CHAPTER 7 Business Analytics with Shipment Models ArbenAsllaniUniversity of Tennessee at Chattanooga Prescriptive Analytics Business Analytics with Management Science Models and Methods
Chapter Outline • Chapter Objectives • Prescriptive Analytics in Action: Danaos Corporation • Introduction • Transportation Models • Example: National Xpress Corporation • Sensitivity Analysis • Transshipment Method • Exploring Big Data with Shipment Model • Wrap Up
Chapter Objectives • Explain shipment models and their structure as special cases of mathematical programming • Demonstrate the use of network diagrams for the transportation and transshipment problems • Learn how to expand transshipment models by adding layers of warehouses or distribution centers • Learn how to check for the feasibility of the transportation models before even attempting to formulate and solve the model • Use Excel templates to set up and formulate transportation or transshipment models as linear programming models
Chapter Objectives • Demonstrate the Solver solutions for the transportation and transshipment problems • Discuss the benefits of using a network diagram to represent a transportation or transshipment model • Perform sensitivity analysis and explain the meaning of the shadow price and reduced cost in the solution of transportation models • Discuss practical recommendation when exploring big data with transportation and transshipment models
Prescriptive Analytics in Action • Danaos Corporation is a leading international owner of containerships • Owns over 59 containerships • 345,000 20-foot standard containers • Global operations: chartering, crewing, and vessel management • ORISMA (Operations Research in Ship Management) • Combines internal and external sources and information such as financial data, hydrodynamic models and weather forecasting • Led to optimum solutions at the operational, tactical and strategic level • Average net profit increase of 8% • Approximately $1 million per vessel per year • The anticipated cost savings for the year 2012 for all ORISMA clients was estimated at $500 million
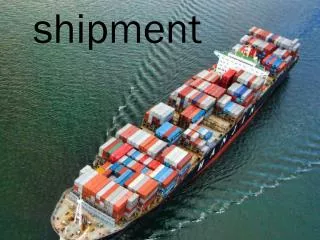
Introduction • Optimization of shipment • Shipment of goods from plants to warehouses, to distribution centers, or other destinations • Include organizational, intra-organizational, and inter-organizational shipments • Count for a significant part of costs • Two types of shipment problems • Transportation model • Transshipment model • Shipment models can be represented with network diagrams • Nodes • Arcs
General Formulation of the Transportation Model • Characteristics of the transportation mode: • The value of the technological coefficients • The direction of the inequality constraints
Network Diagram of Transportation Models • NXT is planning the next month shipments from its four production plans to its three warehouses • Goal: To minimize the total shipping cost Operational Data for the NXT Transportation Model
Solving Transportation Model with Solver Excel Template and Initial Calculations for the Transportation Mode
Sensitivity Analysis:Changes in the Right-hand Side Values • Transportation model has two types of constraints: • Demand Constraints • Supply Constraints
Shipment Costs Per Unite From Plants to Warehouses From Warehouses to Retail Stores
Solving Transportation Model with Solver Excel Template and Initial Solution for the Transshipment Model
Network Diagram for the Final Solution of the Transshipment Model
Exploring Big Data with Shipment Models • The availability of big data in the transportation industry • RFID technology gives decision makers instant access to • Delivery times • Resource utilizations • Geographical coverages • Delivery statuses • The implementation of advanced technologies in transportation and transshipment models allows decision makers to retrieve massive real-time information.
Wrap Up • Two types of shipment problems: • Transportation • Transshipment • Can be represented with network diagrams • Can be formulated as a special case of LP models • Requirement: • the amount of goods available generated by sources be greater than or equal to the demand for these goods • (sometimes) the logistics must assign shipments that minimize overall costs while utilizing all products available and not exceeding market demand • (specific situation) the amount of goods available generated by sources is exactly the same as the demand for these goods
Wrap Up • The solver methodology and sensitivity analysis are similar to the ones used in LP models. • Two sets of decision variables: • Number of units to be shipped from each source to each intermediary destination (warehouse, distribution center) • Number of units to be shipped from each intermediary destination to the final destination. • An equality constraint: balances the number of units entering an intermediary destination with the number of units leaving the same location • Value of the objective function: the sum of two or more scalar products of the costs of shipment with their respective decision variables.